
Figure 3.
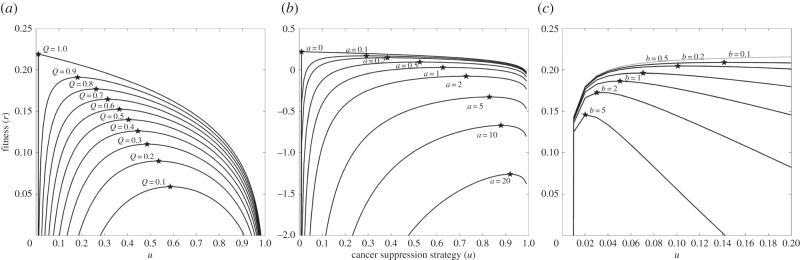
The effects of the propensity for dying of cancer, Q (a), effect of age on this propensity, a (b), and the cost of cancer suppression, b (c), on the optimal level of cancer suppression. The effects are shown as adaptive landscapes that plot fitness, r, as a function of the cancer-suppression trait, u. The different curves show different values for Q, a or b. The peaks of these curves show the optimal level of vigilance, u*, for a given set of parameter values. In going from curve to curve, one sees the effects of Q, a or b on fitness and the optimal level of vigilance. The shape of each curve shows the strength of selection for cancer suppression.