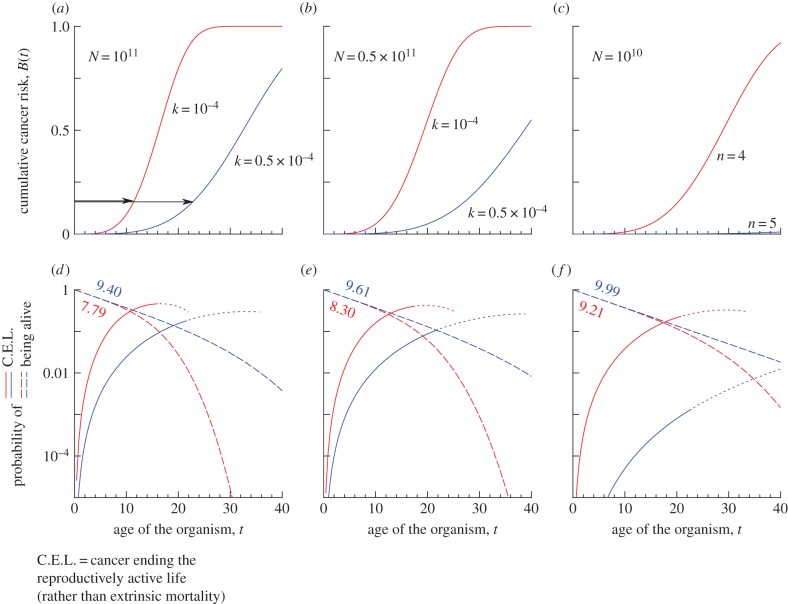
Figure 1.
(a–c) B(t), the cumulative probability (conditional on the individual being alive) that cancer has occurred in at least one of the N cell lineages, as a function of age t, when n = 4 and k = 10–4 unless indicated differently in the figure. In each example, the blue curve has better cancer defences than the red curve, either because (a,b) its k is lower, or (c) because there is an additional defence mechanism that increases the number of rate-limiting steps from n = 4 to n = 5. (d–f) The life-history consequences of (a–c), assuming a constant extrinsic mortality rate of μ = 0.1: the proportion of individuals alive (dashed lines) would decrease linearly in a log-scale plot if there was no cancer; the downcurving from linearity indicates the effects of cancer. The numbers give the expected lifespan, which would be L = 10 in the complete absence of cancer. Solid curves give the probability, for each age t, that cancer is the cause whenever a reproductive career ends at that t. Dotted line style is used when fewer than 1% of individuals are alive from that t onwards, and we do not plot the curve beyond fewer than 0.1% being alive; this helps to emphasize that most individuals end their lives during a stage where cancer's role is increasing, but the overall incidence may remain low throughout in some cases, e.g. in (e) where we assume a small body size N.

