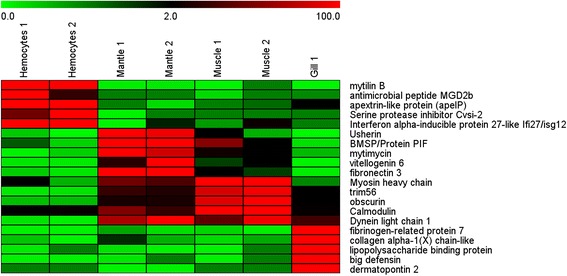
Fig. 6.

Heatmap of a selection of 5 of the most highly expressed genes by tissue, which shows the expression level of all the biological replicates used in this study. The scale bar is a non-linear representation of the normalized expression: Saturated green: no expression, 0 %. Black: 2 % of maximum expression. Saturated red: maximum expression, 100 %
