Fig. 3.

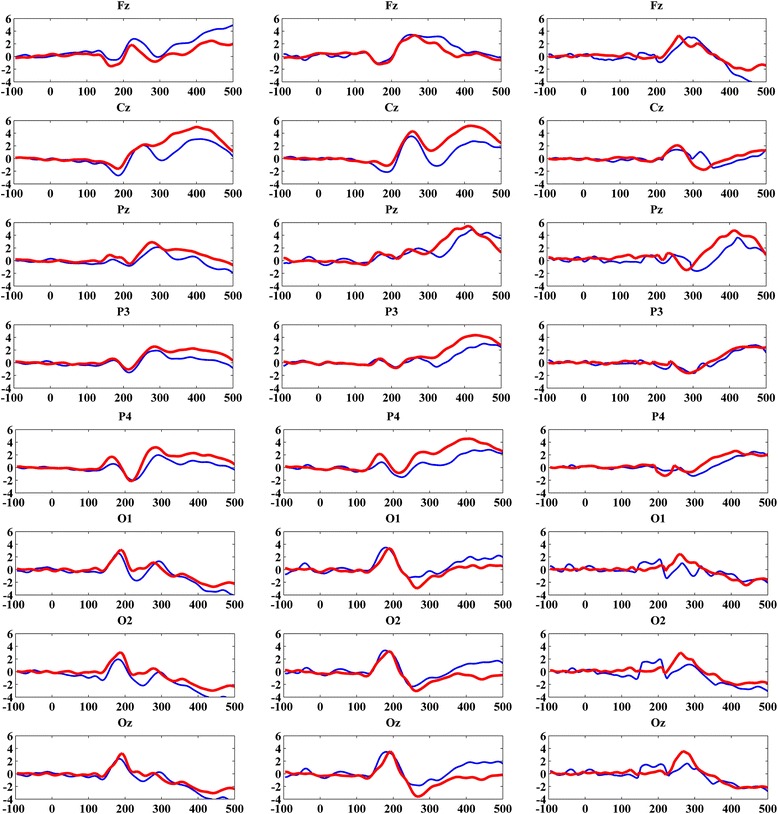
Average ERP waveforms of LA (blue) and HA (red) Groups (Left column represents the standard responses, middle column represents target response and right column represents difference between target and standard responses)

Average ERP waveforms of LA (blue) and HA (red) Groups (Left column represents the standard responses, middle column represents target response and right column represents difference between target and standard responses)