
Fig. 3.
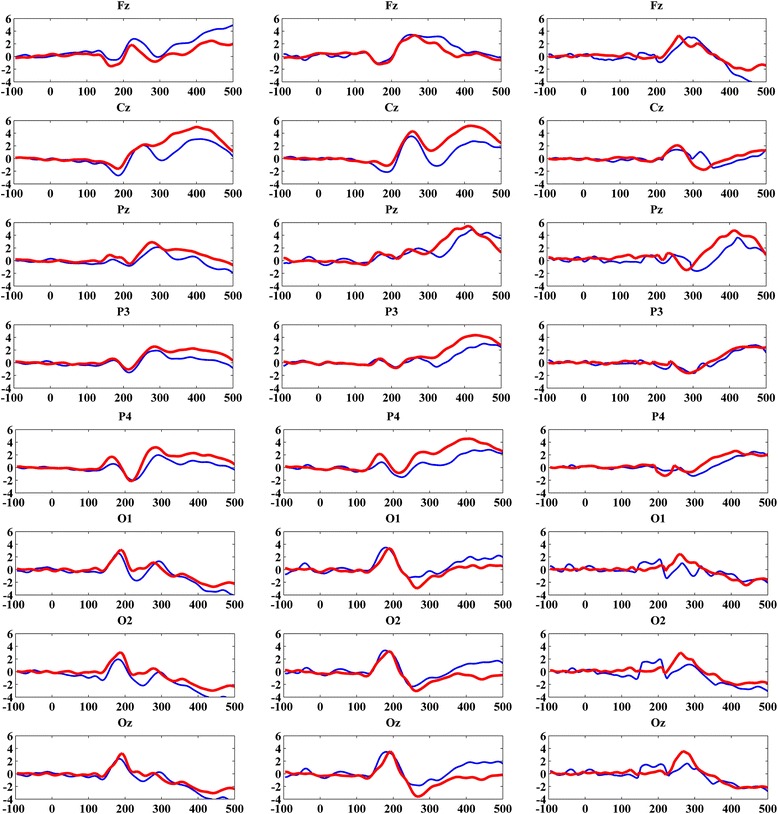
Average ERP waveforms of LA (blue) and HA (red) Groups (Left column represents the standard responses, middle column represents target response and right column represents difference between target and standard responses)
Official websites use .gov
A
.gov website belongs to an official
government organization in the United States.
Secure .gov websites use HTTPS
A lock (
) or https:// means you've safely
connected to the .gov website. Share sensitive
information only on official, secure websites.
Average ERP waveforms of LA (blue) and HA (red) Groups (Left column represents the standard responses, middle column represents target response and right column represents difference between target and standard responses)