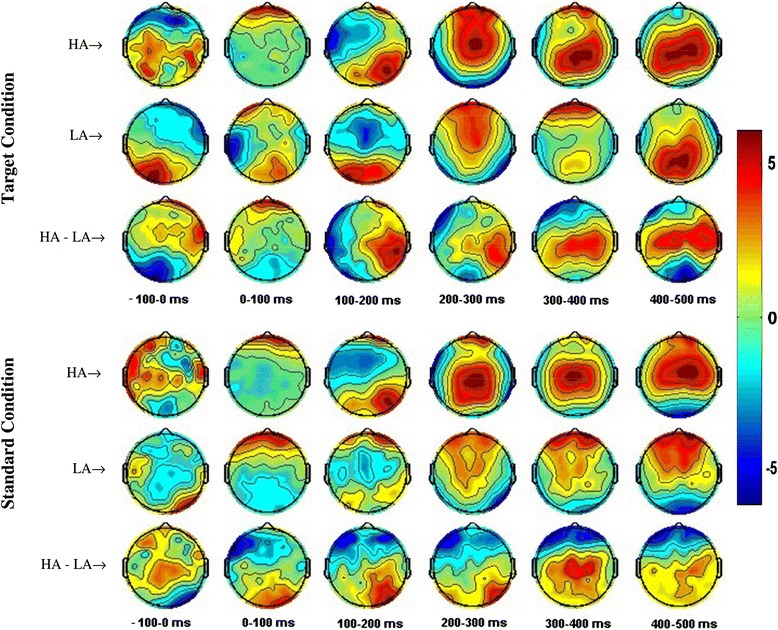
Fig. 6.

Grand average ERP responses of HA and LA Groups from 128 scalp locations. Topographic maps of mean amplitudes averaged over a 100 ms time window from −100 to 0 (pre-stimulus) and 0 to 500 ms (post-stimulus) period for visual oddball task. The first three rows of topographic maps represents brain responses to Target Stimulus for HA, LA and HA-LA; the 4th–6th row shows the brain activity in response to the Standard Stimulus for HA, LA and HA-LA, respectively
