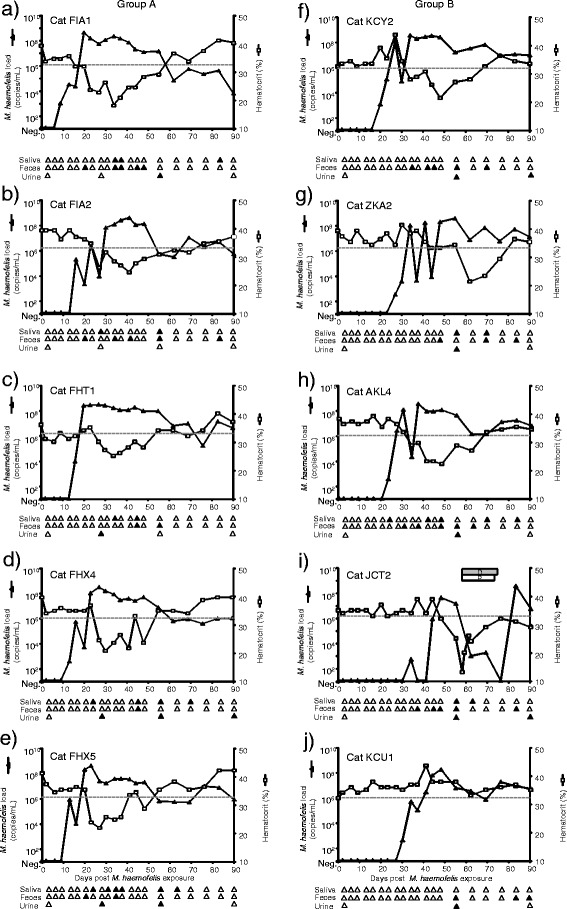
Figure 1.

M. haemofelis loads, shedding patterns and hematocrit after M. haemofelis exposure in ten SPF cats. The five cats in group A had undergone previous “Cand. M. turicensis” infection (A-E) and the five cats in group B were naïve control cats (F-J; the IDs for each cat are indicated in the figure). The M. haemofelis exposure took place on day 0. The blood loads are presented as log DNA copy numbers per mL of blood (left y-axis) as determined by real-time qPCR, and the hematocrit values are given as a percentage (right y-axis). The lower reference value for the hematocrit is indicated by a dotted line. The PCR results from saliva, rectal swabs and urine are illustrated as triangles below the x-axes. The PCR-positive swabs are indicated by filled symbols; PCR-negative swabs are indicated by open symbols. For clarity, only the first 90 days post exposure are shown. The last urine sample listed under day 90 was collected on day 104. Cat JCT2 was treated with doxycycline (gray box marked “D”) and prednisolone (white box marked “P”). The data from group B have been partially previously presented [19].
