Figure 4.

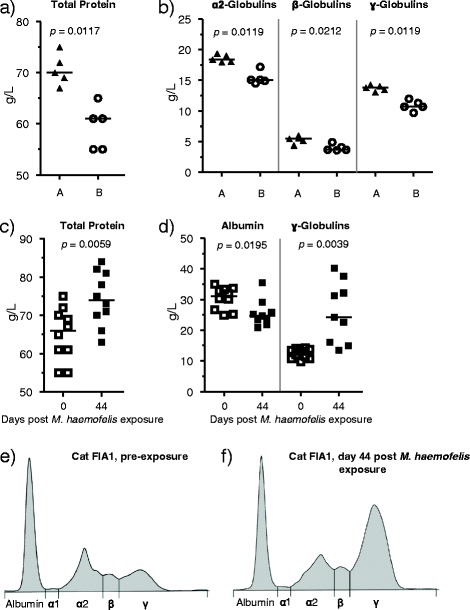
Serum protein electrophoresis results. A and B: pre-exposure values of total protein concentrations (A) and globulins (B) in the cats of groups A (black triangles) and B (open circles). C and D: comparison of the pre-exposure values (day 0; open squares) to those obtained on day 44 post M. haemofelis exposure (black squares). In A through D, the horizontal line indicates the median. P-values (A and B: pMWU, C and D: pW) are indicated in the figure. E and F: representative results for serum protein electrophoresis (of cat FIA1, group A) before (E) and at 44 days post M. haemofelis exposure (F). Albumin concentrations were significantly lower and ɣ-globulin concentrations were significantly higher on day 44 after M. haemofelis exposure compared with the pre-exposure values (D; pW < 0.05). The electrophoretogram conducted with a sample collected on day 44 (F) illustrates polyclonal hypergammaglobulinemia with a ɣ-globulin concentration of 40.2 g/L (reference range: 5.7-16.0 g/L).
