Figure 5.

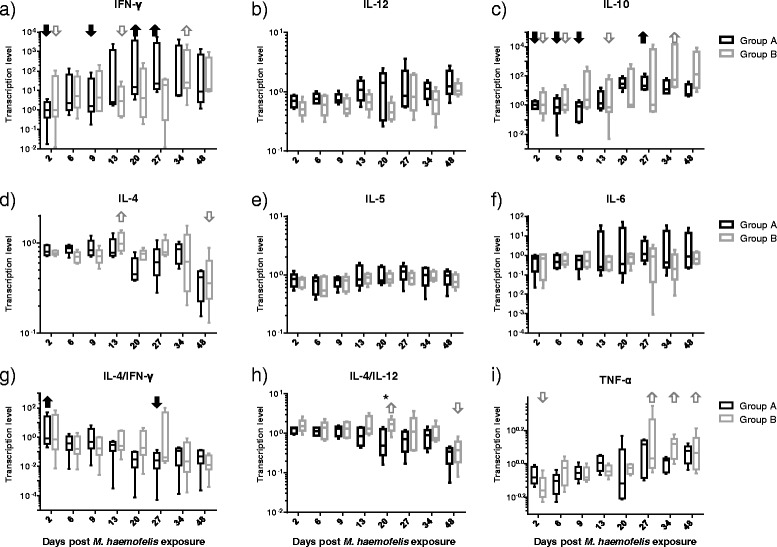
Transcription levels of cytokines after M. haemofelis exposure in the ten SPF cats. The five cats in group A had undergone previous “Cand. M. turicensis” infection and the five cats in group B were naïve control cats. The M. haemofelis exposure took place on day 0. A) IFN-γ, B) IL-12, C) IL-10, D) IL-4, E) IL-5, F) IL-6, G) IL4/IFN-γ ratio, H) IL-4/IL-12 ratio and I) TNF-α. Y-axis: relative transcription levels (log scale). Significant differences over time (pF < 0.05 and pD < 0.05) and the corresponding significantly decreased or increased values are indicated with an arrow (black solid for group A and gray open for group B). In detail, IFN-γ mRNA levels varied over time, with higher values on days 20 and 27 compared with days 2 and 9 in group A and on day 34 compared with days 2 and 13 in group B (A). IL-10 mRNA levels increased throughout the study, with higher levels on day 27 compared with days 2, 6, and 9 in group A and higher levels on day 34 compared with days 2, 6 and 13 in group B (C). IL-4 levels varied over time in both groups with lower IL-4 levels on day 48 compared with day 13 in group B (post test not significant for group A; D). The IL-4/IFN-γ ratio varied in both groups over time, with a decreased in group A from day 2 to 27 (post test not significant for group B; G). The IL-4/IL-12 ratio varied over time in both groups, with a decrease from days 20 to 48 in group B, and lower levels in group A compared with group B on day 20 (H). TNF-α mRNA levels varied over time in both groups, with higher levels observed on days 27, 34 and 48 compared with day 2 in group B (post test not significant for group A; I).
