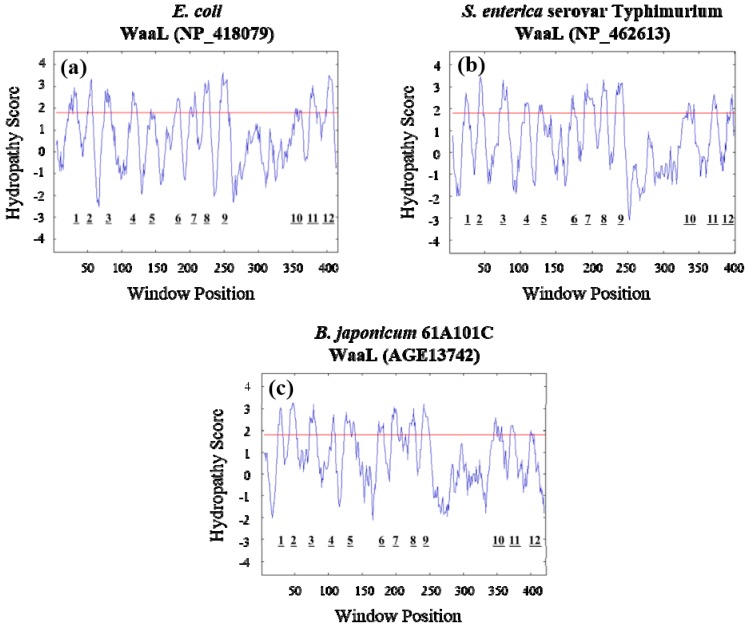
Figure 1.
Comparison of hydropathy plots of WaaL proteins from E. coli (a); S. enterica serovar Typhimurium (b); and B. japonicum 61A101C (c). The x-axis represents the amino acid residue position, while the y-axis represents the relative hydrophobicity score. Peaks above the red line indicate potential membrane-spanning domains. Each protein contains 12 potential membrane-spanning domains.

