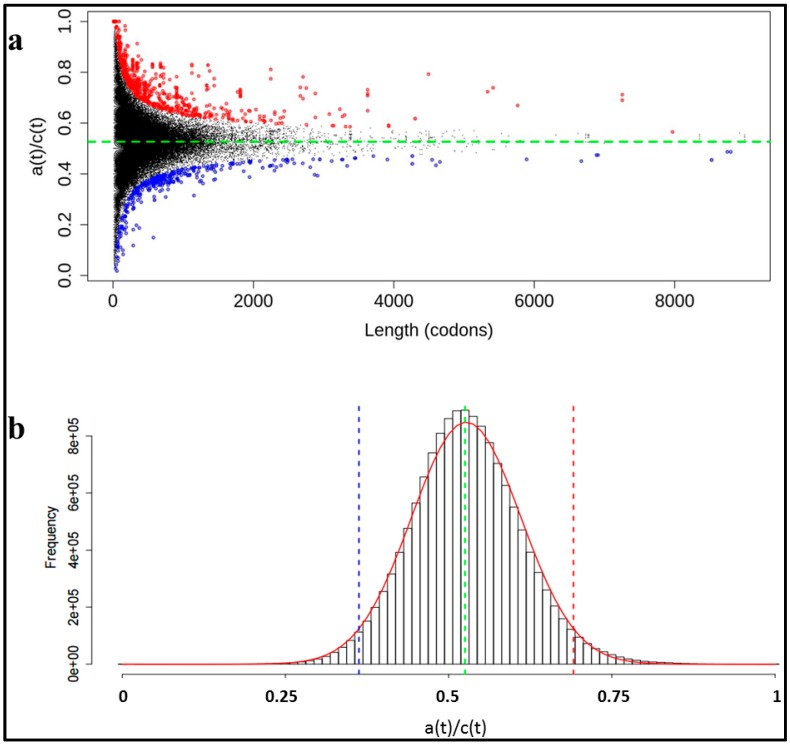
Figure 2.
(a) Distribution of the human transcriptome using the Halves method to study the enrichment in A codons. The dashed green line shows the mean of A codons in the human transcriptome (0.527). Black dots correspond to all the regions obtained with this method (see Section 2.3). Red circles correspond to the enriched regions (2666). Blue circles correspond to the unenriched regions (412). Both regions are calculated supposing a binomial distribution with p-value <10−11; (b) Running Windows Method distribution. a(t) enrichment for all the windows. Red line is the normal distribution following this histogram. Blue and red dashed lines show where the tails of the distribution represents a 5%. Green dashed line shows the mean.

