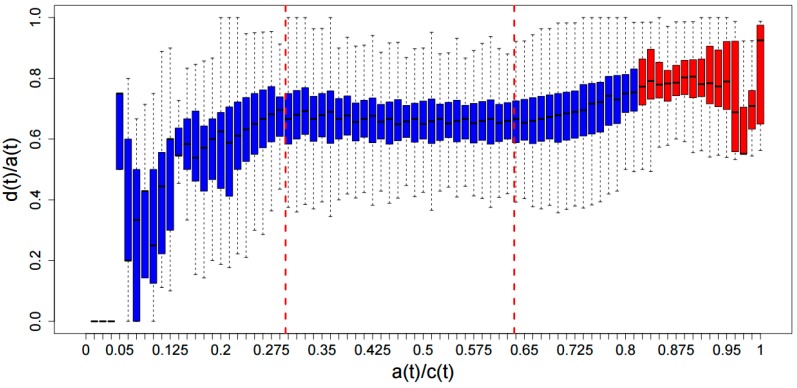
Figure 4.
Graph of boxplots for concentration of A codons, a(t)/c(t), versus the relative concentration of D codons, d(t)/a(t). Blue boxes correspond to current windows, whereas the red ones correspond to the ADAT stretches. Multiple linear regression based on the mean values found two breakpoints at a(t)/c(t) 0.296 and 0.635 (dashed red lines) (See Figure S5 for more details).

