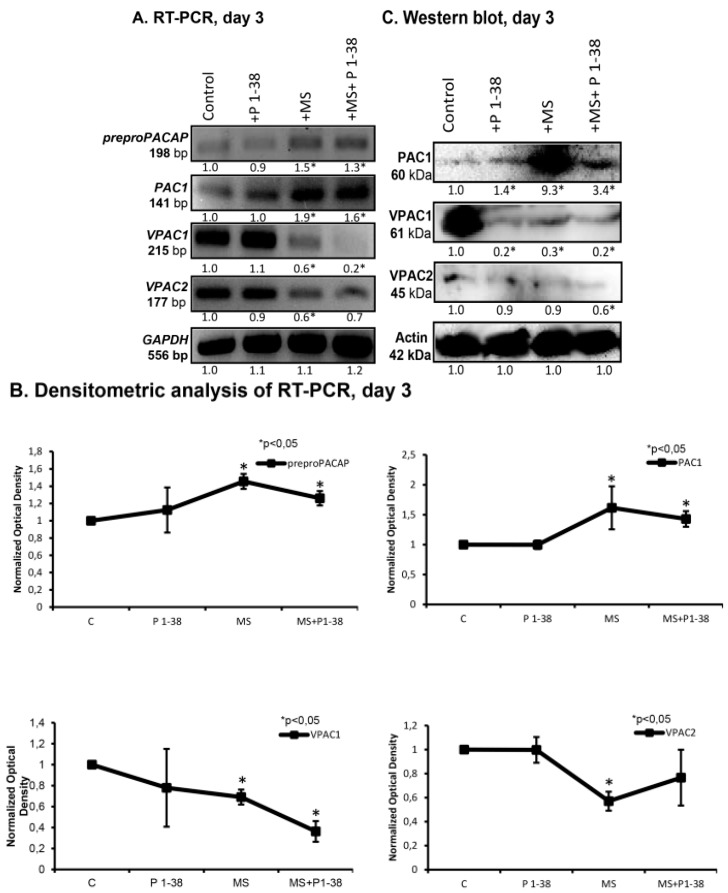
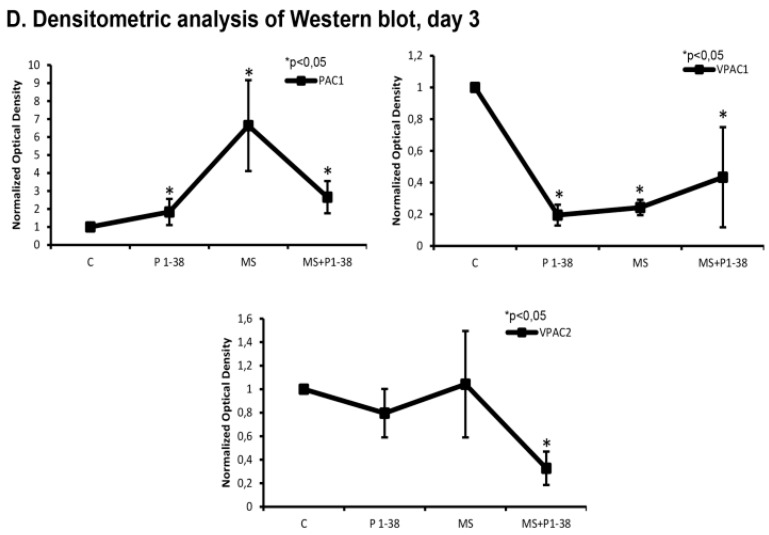
Figure 3.
Expression of preproPACAP and PACAP receptors after PACAP administration and/or mechanical load in chondrifying micromass cultures. For RT-PCR (A) reactions GAPDH and for Western blot (C) reactions Actin was used as control. Optical density of signals was measured and results were normalised to the optical density of controls. For panels (A,C) numbers below signals represent integrated densities of signals determined by ImageJ software. Representative data of three independent experiments; (B,D) Statistical analysis of RT-PCR and Western blot data. All data are the average of at least three different experiments. Statistical analysis was performed by Student’s t-test. All data were normalized on GAPDH/Actin and data are expressed as mean ± SEM. Asterisks indicate significant (* p < 0.05) alteration of expression as compared to the respective control in all panels (C, control; P1–38, PACAP 1–38; MS; mechanical stimulus).


