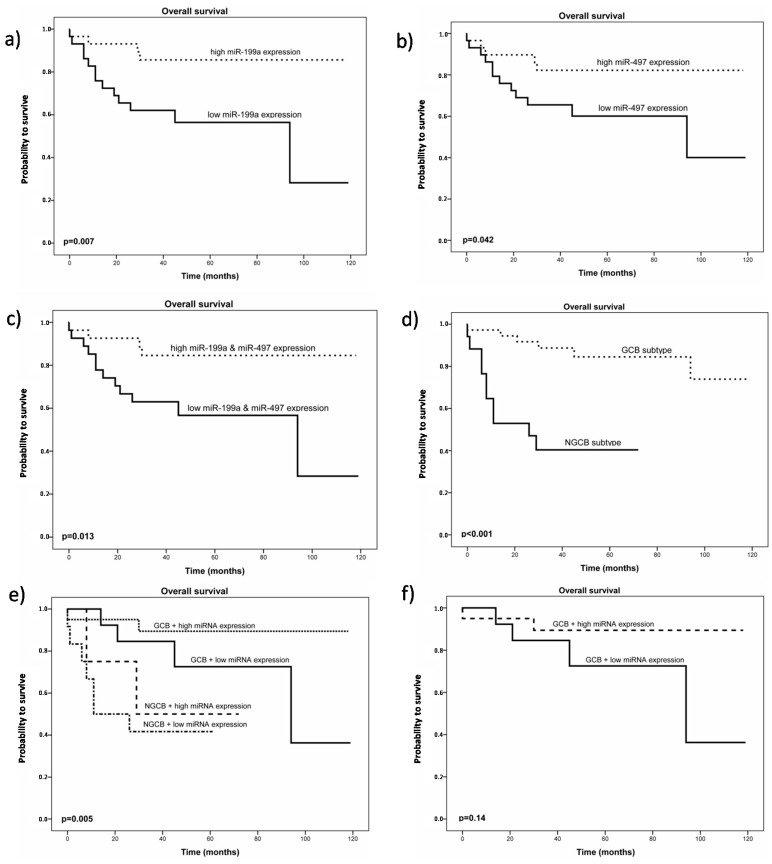
Figure 2.
(a) Kaplan Meier plot for overall survival in patients with diffuse large B-cell lymphoma (DLBCL) (n = 58) stratified by miR-199a expression level. The black dotted line represents patients with high miR-199a expression levels; (b) Kaplan Meier plot for overall survival in patients with DLBCL (n = 58) stratified by miR-497 expression level. The black dotted line represents patients with high miR-497 expression levels; (c) Kaplan Meier plot for overall survival in patients with DLBCL (n = 58) stratified by miR-199a and miR-497 expression levels. The black dotted line represents patients with high miR-199a and high miR-497 expression levels; (d) Kaplan Meier plot for overall survival in patients with DLBCL (n = 55) stratified by their Immunohistochemistry (IHC) profile; (e) Kaplan Meier plot for overall survival in patients with DLBCL (n = 58) stratified by their IHC profile combined with miR-199a and miR-497 expression levels; (f) Kaplan Meier plot for overall survival in patients with DLBCL, germinal center subtype (GCB) (n = 38) stratified by miR-199a and miR-497 expression level. The black dotted line represents patients with high miR-199a and miR-497 expression levels.

