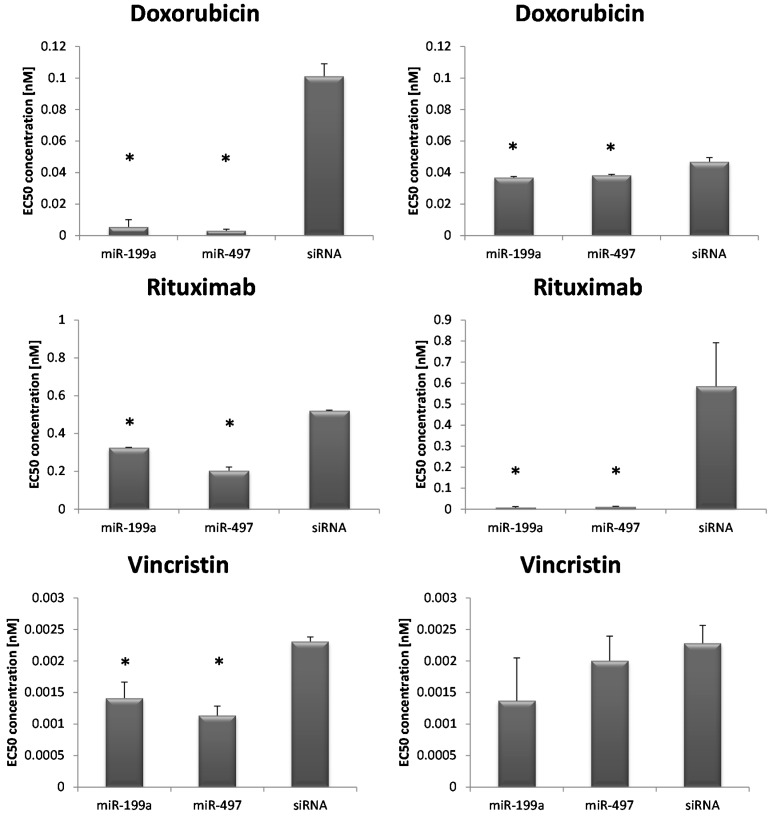
Figure 3.
Screening test with 3-(4,5-dimethylthiazol-2-yl)-5-(3-carboxymethoxyphenyl)-2-(4-sulfophenyl)-2H-tetrazolium (MTS) assay. EC50 (half maximal effective concentration) concentrations of doxorubicin, rituximab and vincristin of transfected RI-1 (left column) and SUDHL4 (right column) cells. Each bar represents the mean values of the EC50 concentration in nM ± standard deviation of either miR-199a or miR-497 transfected cells or siRNA control, respectively. The comparison of the expression levels was performed by using the Mann–Whitney U test. * indicates reduced EC50 concentration compared to siRNA (p < 0.05).

