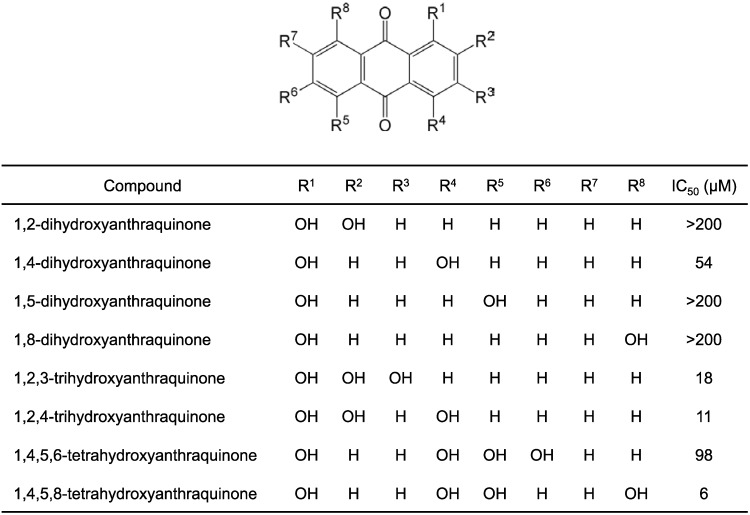
Figure 1.
Structures of hydroxyanthraquinones and their IC50 values for NS3 helicase inhibition. The IC50 values were obtained from inhibition curves (Figure S1). The data in the inhibition curves are presented as mean ± standard deviation (SD) of three replicates using the fluorescence helicase assay. The NS3 helicase activities of samples containing inhibitor were calculated relative to control samples, containing DMSO vehicle instead of inhibitor.

