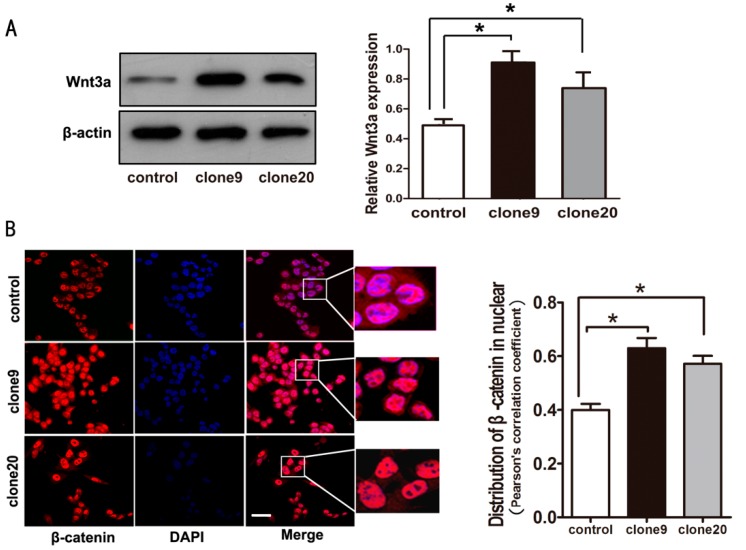
Figure 3.
Wnt3a overexpression-induced activation of Wnt/β-catenin signaling in HT29 cells. (A) Wnt3a protein expression levels were significantly increased in clone9 and clone20, and HT29 cell pools transfected with Wnt3a plasmid (left). Relative amount of protein expression of Wnt3a/β-actin (right) (* p < 0.05); (B) Increased β-catenin accumulation in the nucleus was observed in cells overexpressing Wnt3a compared to control cells (immunofluorescent staining) (left). Scale bar: 50 μm. Red signal represents staining for β-catenin, and blue signal represents nuclear DNA staining by DAPI. Microscopic analysis of β-catenin with DAPI showed increased nuclear β-catenin distribution in cells overexpressing Wnt3a (right) (* p < 0.05).

