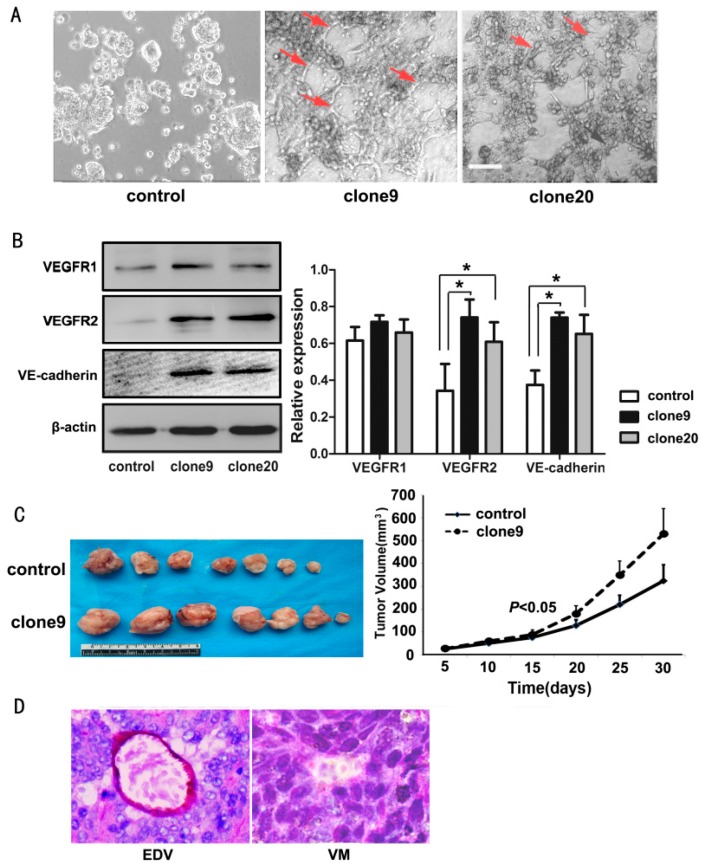
Figure 4.
Wnt3a promoted the VM-forming ability in HT29 cells. (A) HT29 cells cannot form typical tube-like structures in the 3D culture, whereas Wnt3a-overexpressing clone9 and clone20 cells formed few tubular structures (red arrows). Scale bar: 100 μm; (B) Upregulated Wnt3a expression in HT29 cells results in increased VEGFR2 and VE-cadherin expressions. No significant change in VEGFR1 expression was observed (left) (* p < 0.05). Relative amount of protein expression of VEGFR1, VEGFR2, and VE-cadherin compared with β-actin (right); (C) Representative xenograft tumors of the control or Wnt3a-overexpressing HT29 cells (clone9) on the 30th day post injection (left). Tumor volumes are monitored over time (right); (D) VM structure and endothelial-dependent vessels in xenograft tumors (CD34/PAS double staining, ×400).

