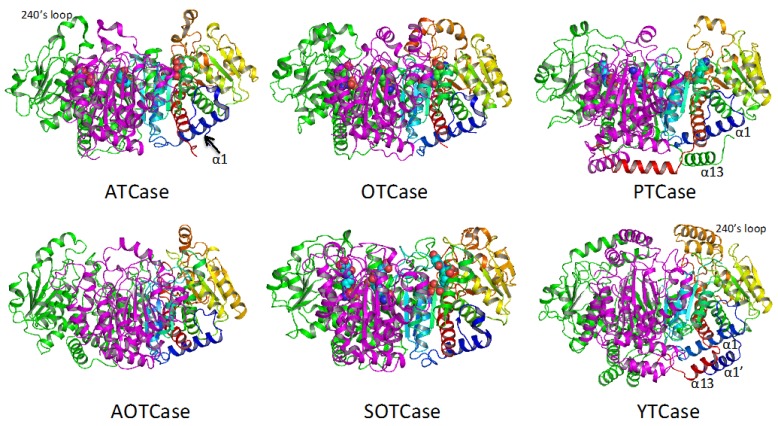
Figure 5.
Ribbon diagram of the catalytic trimer of Escherichia coli ATCase, E. coli OTCase, Enterococus faecalis PTCase, Xanthomonas campestris AOTCase, Bacteroides fragilis SOTCase and E. coli YTCase, viewed perpendicular to the three-fold axis. Different subunits are shown in different colors (rainbow, green and magenta, respectively). The bound substrates or inhibitors are shown as space-filling models.

