Figure 1.
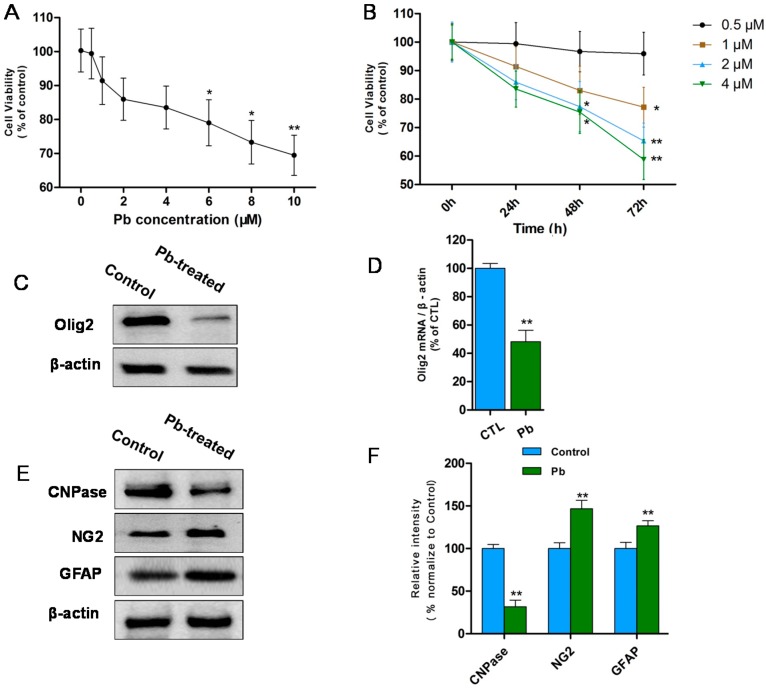
(A) MTT assay (0.5–10 μM Pb acetate for 24 h) showed that cell viability decreases in a dose-dependent manner from 1 to 10 μM. Significant differences appeared after concentration reached 6 μM. The values represents the mean ± S.E.M. (standard error of the mean) (n = 3). * p < 0.05; ** p < 0.01 vs. control group; (B) MTT assay (0.5–4 μM Pb acetate for 0–72 h) revealed that 1 μM Pb notably decreases cell viability at 72 h and 2, 4 μM Pb caused significant reduction at 48 h. The values represent the mean ± S.E.M. (n = 3). * p < 0.05; ** p < 0.01 vs. control group; (C) Western blot analysis revealed that Olig2 protein levels decreased after treated with 1 μM Pb (24 h) and differentiated for 3 days compared with controls; (D) Relative quantification of Western blot analysis is depicted in the bar graphs. The values represent the mean ± S.E.M. (n = 3). ** p < 0.01 vs. Control group; (E) Western blot analysis showed reduction in CNPase protein and NG2, GFAP increased after treated with 1 μM Pb (24 h) and differentiated for 3 days compared with controls; and (F) Relative quantification of Western blot analysis is depicted in the bar graphs. The values represent the mean ± S.E.M. (n = 3). ** p < 0.01 vs. control group.

