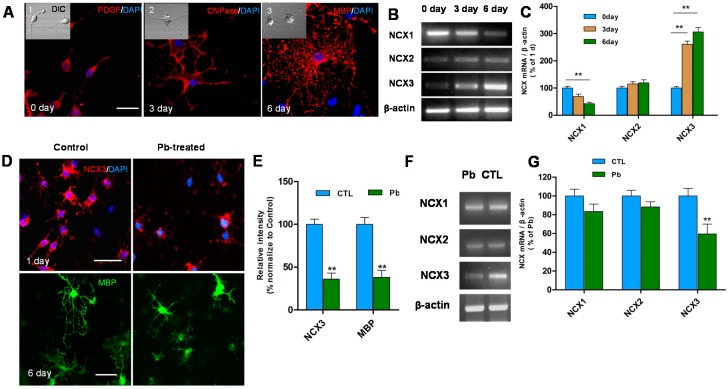
Figure 2.
(A) Differentiated OLs were identified by immunofluorescence staining. PDGFα (an OPCs marker), CNPase (a developing OLs marker) and MBP (a mature OLs marker) demonstrates the morphologic characteristics of OPCs exposed to differentiation medium 0 day (A1), 3 day (A2) and 6 day (A3) with Differential Interference Contrast (DIC) pictures on the top left. Scale bar = 50 μm; (B) RT-PCR shows the expression levels of three types of NCX mRNA at 0, 3 and 6 day after exposure to differentiation medium; (C) Relative quantification of RT-PCR analysis is depicted in the bar graphs. The values represent the mean ± S.E.M. (n = 3). ** p < 0.01 vs. control group; (D) NCX3 (red) positive cells decreased in OPCs exposed to differentiation medium one day after Pb treatment. Scale bar = 100 μm. MBP (green) positive cells were smaller with fewer processes compared to untreated controls. Scale bar = 50 μm; (E) Relative quantification of NCX3 and MBP staining is depicted in the bar graphs. The values represents the mean ± S.E.M. (n = 5). ** p < 0.01 vs. control group; (F) RT-PCR showed the significant reduction in expression of NCX3 mRNA after 3 day with Pb exposure (24 h) and no obvious changes were observed in NCX1, NCX2; and (G) Relative quantification of RT-PCR analysis is depicted in the bar graphs. The values represents the mean ± S.E.M. (n = 3). ** p < 0.01 vs. control group.

