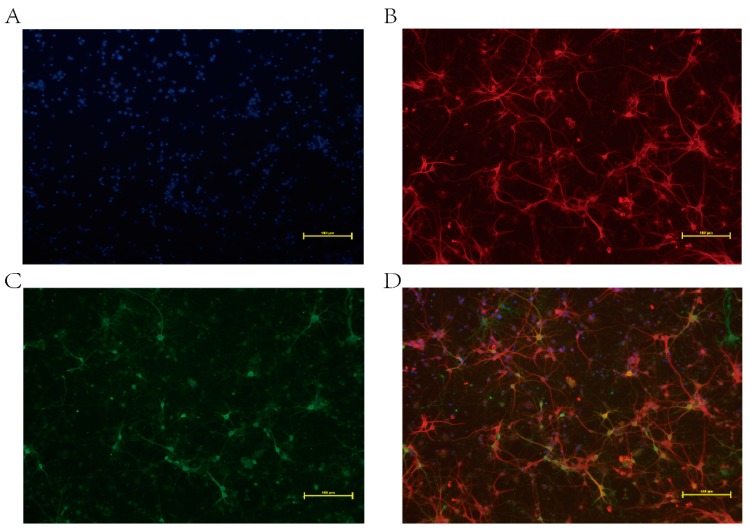
Figure 1.
Immunofluorescence analysis of Borna disease virus (BDV)-infected neurons on day 12 post-infection. (A) Nuclei stained with DAPI (4′,6-diamidino-2-phenylindole) (blue); (B) Neurons marked with chicken polyclonal MAP-2 (neuron-specific marker) followed by a FITC (Fluorescein isothiocyanate isomer I)-labeled secondary antibody (red, goat anti-chicken); (C) BDV P40 detected with a primary monoclonal antibody followed by a FITC-labeled secondary antibody (green, goat anti-mouse); (D) Merged image. Scale bars: 100 μm.

