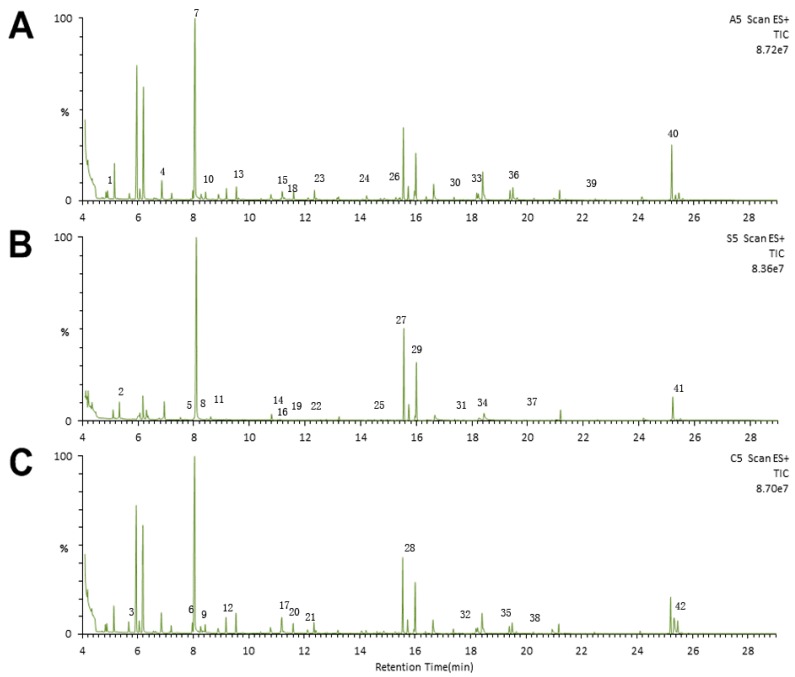
Figure 2.
Representative gas chromatography–mass spectrometry (GC–MS) total ion chromatograms. Chromatograms from the (A) Hu-H1 group; (B) Strain V group; and (C) non-infected control (CON) group. (1) Pyruvic acid; (2) Glycolic acid; (3) l-Alanine; (4) l-Valine; (5) Ethanolamine; (6) l-Leucine; (7) Glycerol; (8) l-Isoleucine; (9) l-Proline; (10) Glycine; (11) Methylsuccinic acid; (12) Serine; (13) l-Threonine; (14) Malic acid; (15) l-Methionine; (16) Pyroglutamic acid; (17) l-Aspartic acid; (18) γ-Aminobutyric acid; (19) Creatinine; (20) l-Cysteine; (21) 3-Hydroxy-3-methylglutaric acid; (22) l-Glutamic acid; (23) Phenylalanine; (24) Glycerol-3-phosphate; (25) Citric acid; (26) d-Fructose; (27) d-Glucose; (28) l-Lysine; (29) Sorbitol; (30) Myo-Inositol; (31) Margaric acid; (32) Ribulose-5-phosphate; (33) Oleic acid; (34) Octadecanoic acid; (35) d-Fructose-6-phosphate; (36) d-Glucose-6-phosphate; (37) Eicosanoic acid; (38) Myo-Inositol-1-phosphate; (39) d-Lactose; (40) Cholesterol; (41) Lanosterol; (42) Desmosterol.

