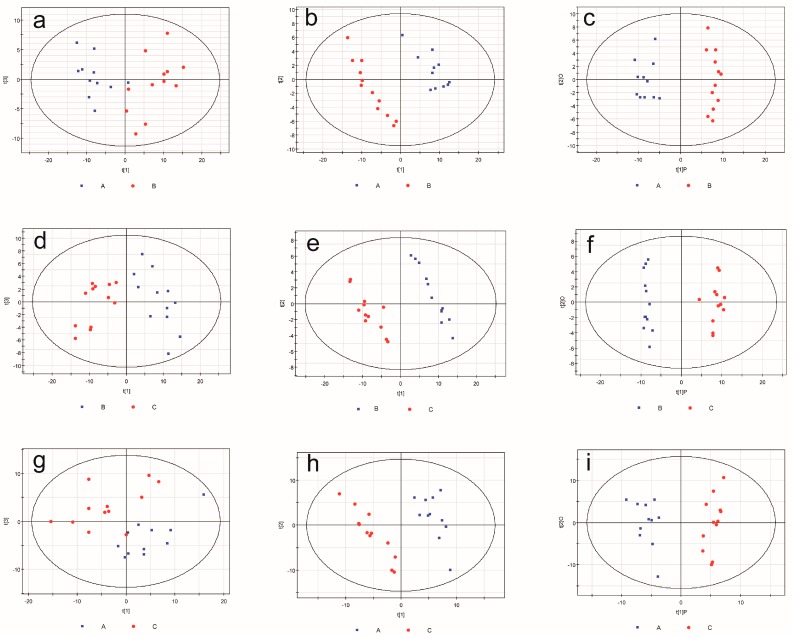
Figure 3.
Multivariate statistical analysis. Principal component analysis (PCA) scores plot derived from GC–MS spectra of rat cortical neurons infected from (a) Hu-H1 and Strain V; (d) Strain V and non-infected control (CON); and (g) Hu-H1 and CON. Paired partial least-squares discriminant analysis (PLS-DA) model showing a clear separation between rat cortical neurons infected from (b) Hu-H1 and Strain V; (e) Strain V and CON; and (h) Hu-H1 and CON. Orthogonal partial least-squares discriminant analysis (OPLS-DA) model showing clear separation between rat cortical neurons infected with (c) Hu-H1 and Strain V; (f) Strain V and CON; and (i) Hu-H1 and CON. (A represents Hu-H1; B represents Strain V; C represents non-infected control (CON).)

