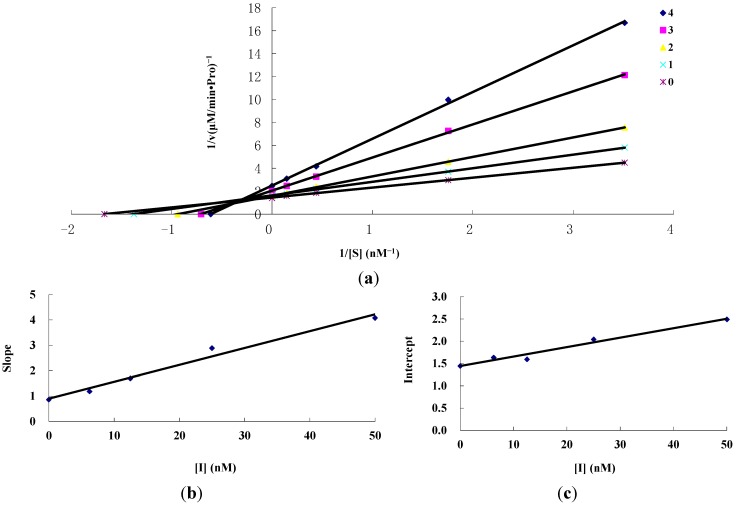
Figure 4.
Inhibition kinetics of rotenone on mitochondrial complex I by Lineweaver–Burk plots. Concentrations of (a) for curves 0–4 were 0, 6.25, 12.5, 25 and 50 nM, respectively; Figure (b) and (c) represent the secondary plot of the slope and the intercept of the straight lines versus concentration of inhibitor, respectively.

