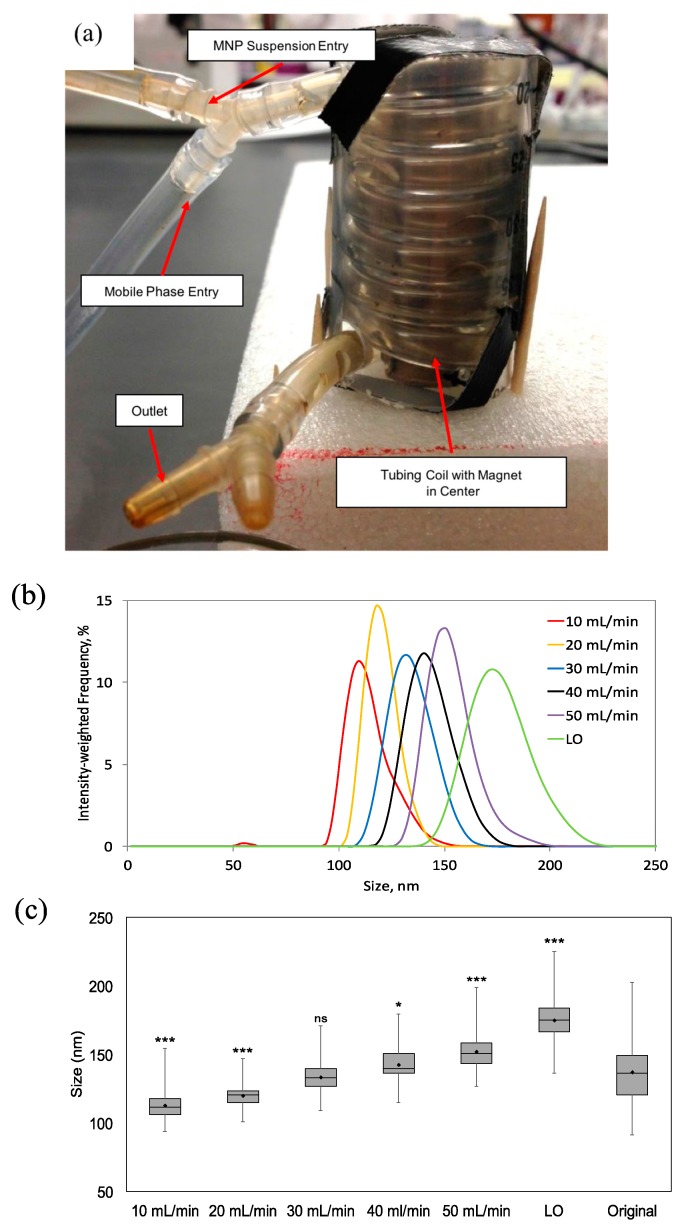
Figure 4.
(a) Digital image of MagCoil magnetic separation prototype composed of 1/8′′ I.D. tubing wrapped around the length of a 2′′ diametrically magnetized cylinder encased in a plastic column for stability; (b) Average size distributions obtained using the MagCoil prototype and flow rates of 10, 20, 30, 40, and 50 mL/min, as well as the flushed particles (LO) calculated from the results of three separate experimental runs; (c) Box-and-whisker plot comparing the size distributions obtained using the MagCoil, at the varying flowrates, to the original size distribution. Horizontal lines indicate the mean diameter (nm), while the bar indicates standard deviation, and the vertical line the range. Significance determined using a two-tailed, two sample t-test (n = 90; *** p < 0.001; * p < 0.05; ns—not significant). The large sampling size of DLS (>100 k particle counts/s) leads to a statistically significant result between samples that would seem to be identical otherwise.

