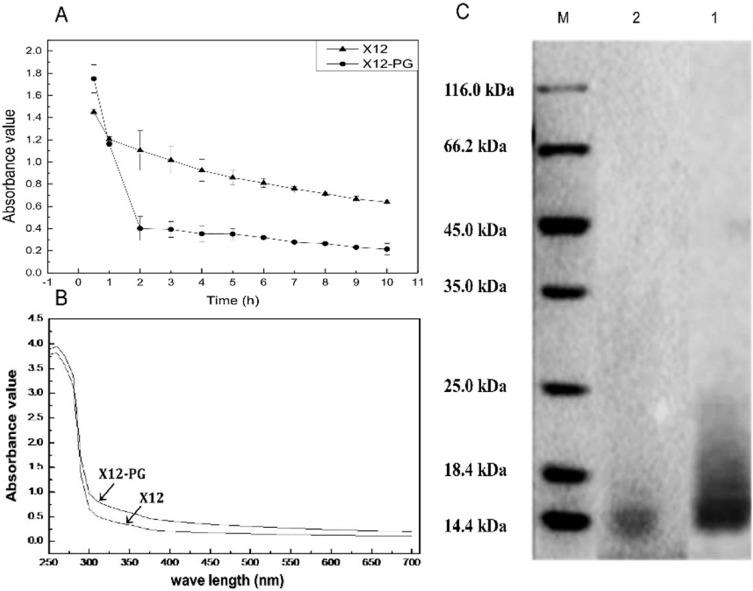
Figure 2.
Quantitative and qualitative analysis of X12-PG. (A) The degradation models of X12-PG and X12 when exposed to lysozyme. A450 nm of X12-PG declined faster than that of X12; (B) The UV-visible scanning spectrum of X12-PG and peptidoglycan standard. The standards and samples were scanned between 190 and 700 nm in a UV/VIS spectrophotometer; and (C) The molecular weight (kDa) of X12-PG quantified by SDS-PAGE. The gels were stained with Coomassie Brilliant Blue. The molecular weight was 14 kDa, corresponding to the peptidoglycan standard. Each graph represents the average of more than three replications.

