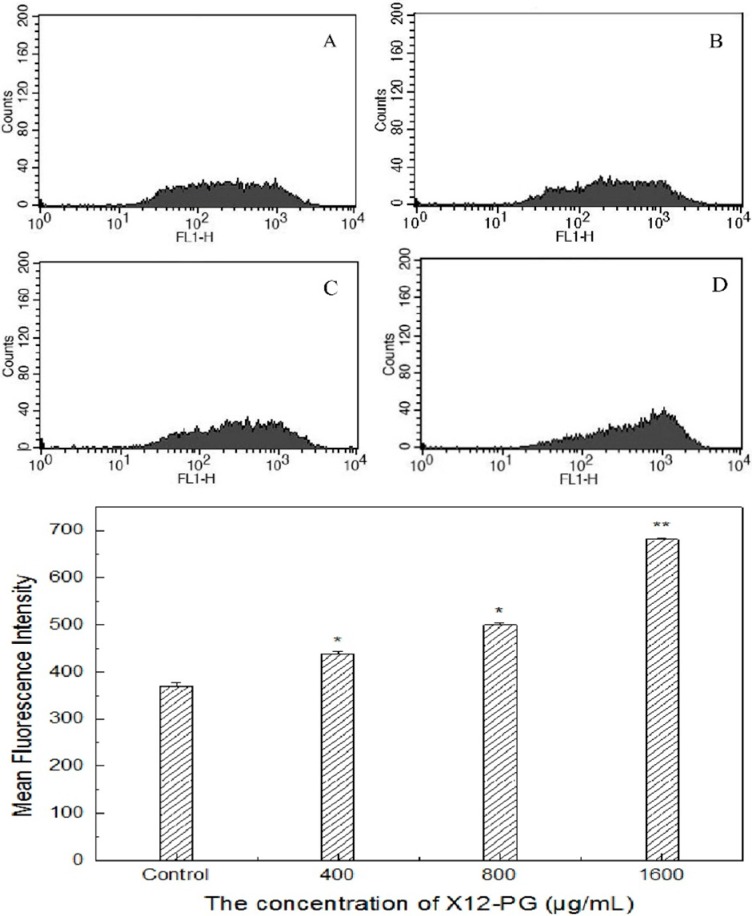
Figure 7.
Intracellular Ca2+ concentration ([Ca2+]) after treatment of X12-PG. (A–D) were respectively treated with 0, 400, 800, 1600 μg/mL X12-PG for 48 h. Cytosolic [Ca2+] was increased in a dose-dependent manner after exposure to X12-PG. HT-29 cells were loaded with Fluo-3/AM and analyzed by flow cytometry. Fluo-3/AM was excited at the 488 nm line of an argon laser and the fluorescence intensity was measured at an emission wavelength 530 nm. [Ca2+] was expressed as mean fluorescence intensity (MFI). (Error bars are mean ± SD, * p < 0.05 versus control, ** p < 0.01 versus control).

