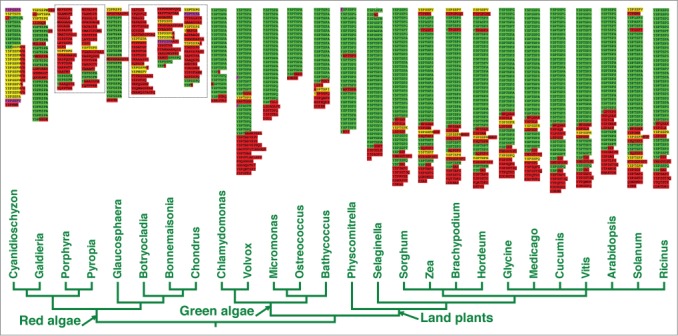
Figure 1.

The CTD in green plants and red algae. The tree reflecting the relationships among green algae/plants and red algae was constructed based on the Tree of Life Web Project. Annotated CTDs for each genus are shown above the taxa included in the tree (CTD N-termini are at the top of each sequence). Sequences from multicellular red algae are shown in boxes; they have highly modified CTDs with no discernable repetitive structures that are present in unicellular (ancestral) forms. Green indicates regions with at least 2 continuous canonical (YSPxSPx) heptapeptides; yellow indicates the presence of isolated heptads, not in tandem with another canonical repeat; purple indicates the presence of the non-canonical motif “FSPTSPS;" red regions are without any canonical heptapeptides whatsoever. For more detail on these annotations, see our previous publication.13
