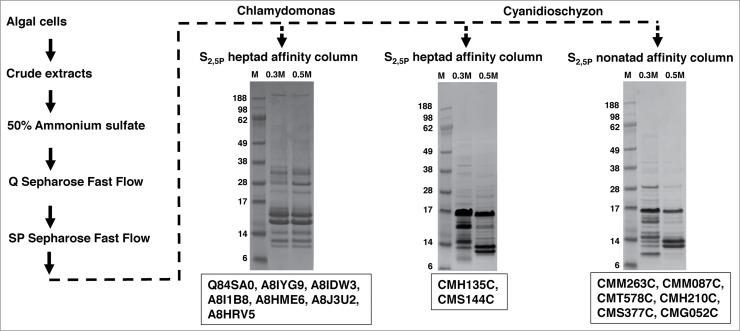
Figure 2.
PCAP purification process. The PCAP purification process is shown step by step as indicated by the direction of the arrows. The elution from each affinity column was subjected to SDS-PAGE followed by staining with Coomassie blue. The gels run on elutions are shown for each affinity column. M represents molecular weight (KDa) marker, 0.3 M and 0.5 M indicates elution with those concentrations of NaCl in BH buffer. The putative PCAPs from each elution highlighted in our results section are shown under the respective gels.

