
Fig. 3.
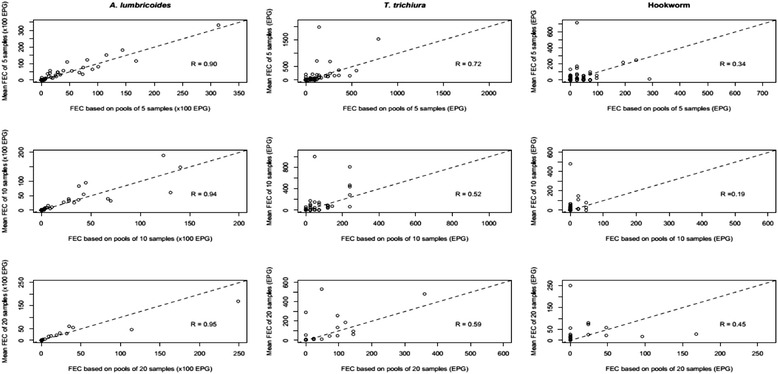
Agreement in faecal egg counts (FEC; expressed in eggs per gram of stool (EPG)) of soil-transmitted helminths between individual and pooled samples. Each of the 9 scatter plots represents the agreement in mean individual FEC and pooled FEC of stool samples. The plots in the first column represent Ascaris lumbricoides, second column Trichuris trichiura, and the third column hookworm. The plots in top, middle and bottom row represent pool sizes of 5, 10 and 20, respectively. The magnitude of correlation for each plot is based on the Pearson’s correlation coefficient (R)