Figure 3.
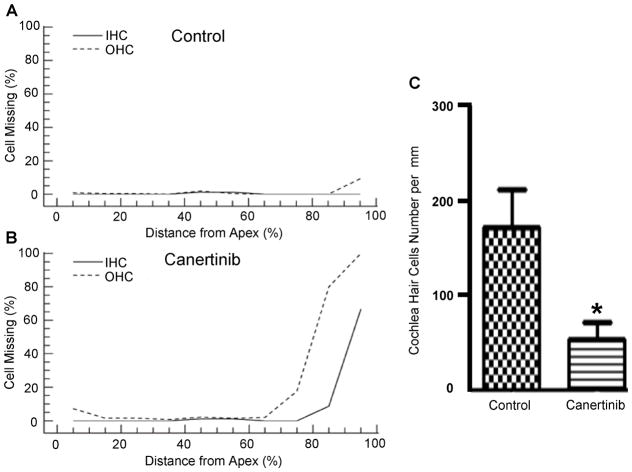
Loss of hair cells after canertinib treatment. The same C57BL/6J mice were used for histological quantification of hair cells. Hair cell counts were graphically displayed for both the control (A) and canertinib-treated (B) mice from apex to base (the x-axis is % distance from the apex; n=7 for the control group, and n=8 for the drug-treated group). Quantitative data of OHC density was collected from the regions that were 70% distant from the cochlear apex, and compared between the control and the drug-treated group (C). Data plotted as mean +/− SEM. (* p < 0.05, ** p < 0.001).

