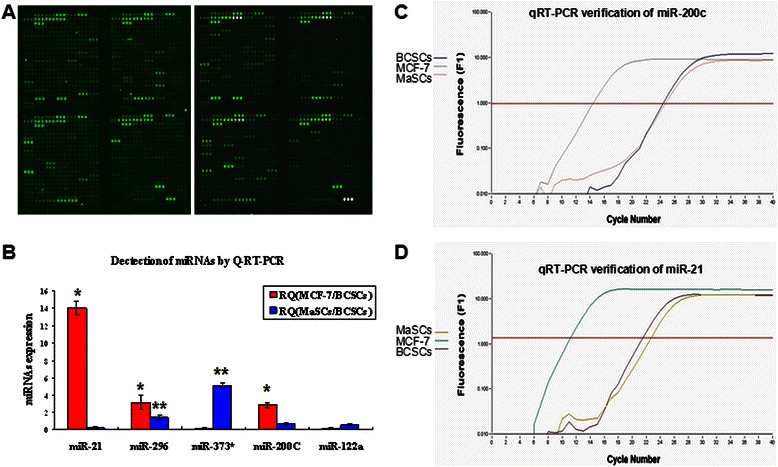
Fig. 2.

Microarray analysis of miRNA expression in MaSCs and qRT-PCR verification. a. Duplicate microarray analyses of miRNA expression in MaSCs. Triplicate dots on the microarray exhibit consistent signal intensity. b. Relative quantitative (RQ) expressions of 5 miRNAs in MCF-7/BCSCs/MaSCs shown as mean ± standard deviation (SD). (*, The expressions of miR-21, miR-296 and miR-200c are significantly higher in MCF-7 than in BCSCs. **, the expression of miR-373* is significantly higher in MaSCs than in BCSCs). c. Amplification curve of miR-200c in MCF-7/BCSCs/MaSCs. Comparison of miR-200c expressions tends to be MaSCs < BCSCs < MCF-7. d. Amplification curve of miR-21 in MCF-7/BCSCs/MaSCs. Comparison of miR-21 expressions tends to be MaSCs < BCSCs < MCF-7
