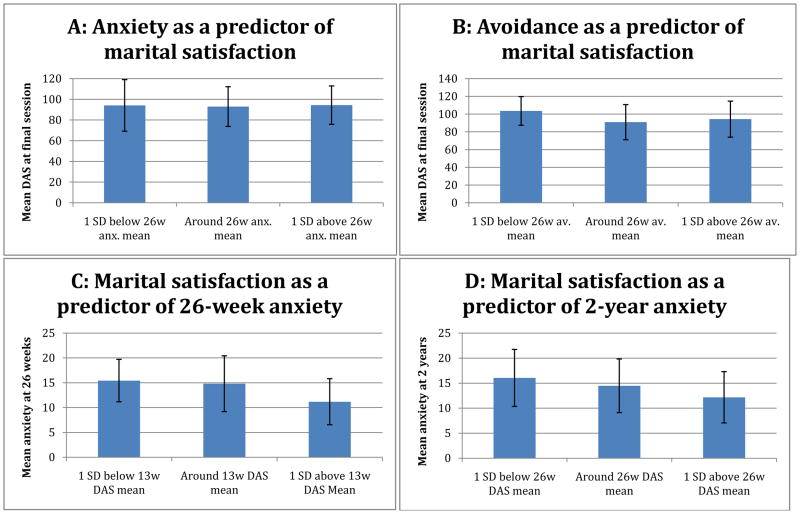
Figure 1. Illustrating the results of four multilevel models by depicting the mean value of the dependent variable at high, mean, and low values of the predictor variable.
Notes: The heights of the bars represent the mean value of the dependent variable for a group with a mean level of the predictor variable, a high (one standard deviation above the mean) level of the predictor variable, or a low (one standard deviation below the mean) level of the predictor variable. These values are indicative of the findings from the multilevel models (see Table 3). Error bars represent standard deviations.

