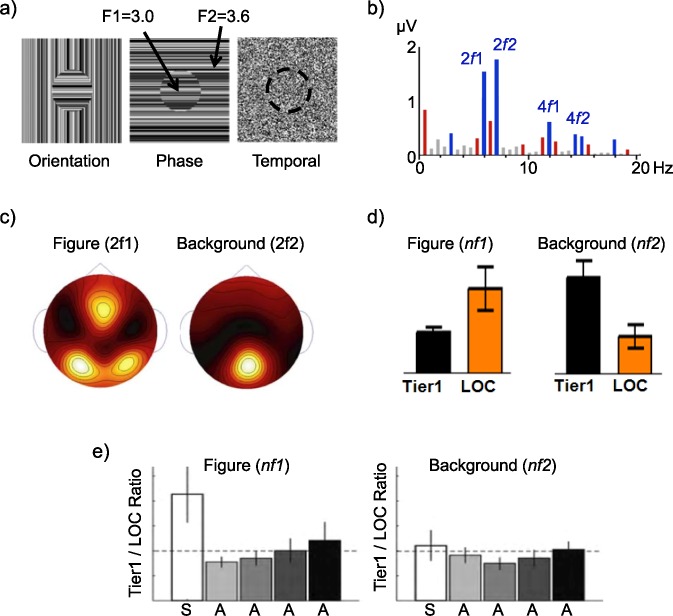
Figure 11.
Figure–ground segmentation studies of Appelbaum and colleagues (Appelbaum et al., 2010; Appelbaum et al., 2006, 2008). (a) Stimuli in these studies were comprised of two-frequency textures in which a central circular figure alternated at 3.0 Hz (f1) and the surround alternated at 3.6 Hz (f2). These stimuli were composed of three different texture cues: orientation modulation of one-dimensional textures, phase modulation of one-dimensional textures, and white noise. (b) Example EEG response spectra, with significant responses colored (blue are harmonics of the figure and background, red are IM terms). (c) Topographic response distributions of second harmonics show distinct patterns. (d) Source-localized ROI profiles show a double dissociation, wherein the figure response (summed over harmonics) is large in the LOC and the background response is larger in first-tier retinotopic areas V1–V3. This pattern is present for all three cues, figure sizes of 2° and 5°, and figures presented at different retinal eccentricities. (e) Figure selectivity, as a ratio of retinotopic to LOC response, is only present for the surrounded stimulus (S), which shows a figure surrounded by a background, not for ambiguous (A) stimuli that do not have this Gestalt arrangement.

