
Figure 12.
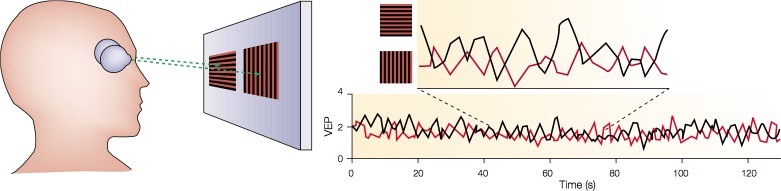
Frequency tagging used to measure rivalry in real time. The participant viewed a vertical grating oscillating at 5 Hz in one eye and a horizontal grating oscillating at 6 Hz in the other eye. Because the two stimuli were not binocularly fusable, they alternated in perceptual dominance. The curves on the right plot the time course of the evoked responses at the separate eye-tagging frequencies. The two time courses alternate in counterphase in sync with the perceptual alterations. From Blake and Logothetis (2002).