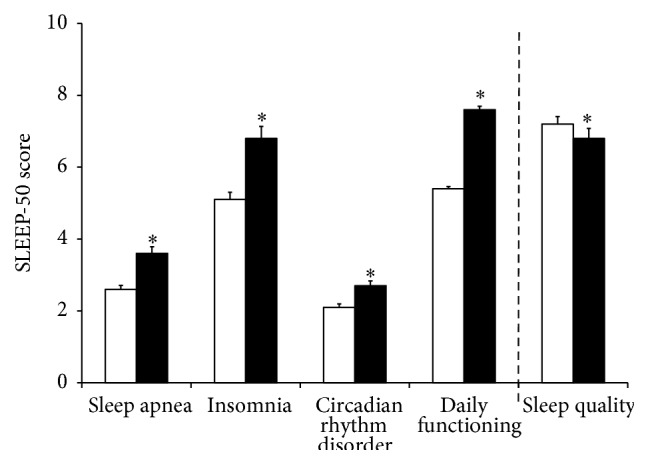
Figure 1.

Mean (SE) scores of subjects with perceived normal health status (white bars) or perceived reduced immune functioning (black bars) on sleep disorders, sleep quality, and daily functioning. Significant differences (p < 0.05) are indicated by an asterisk.
