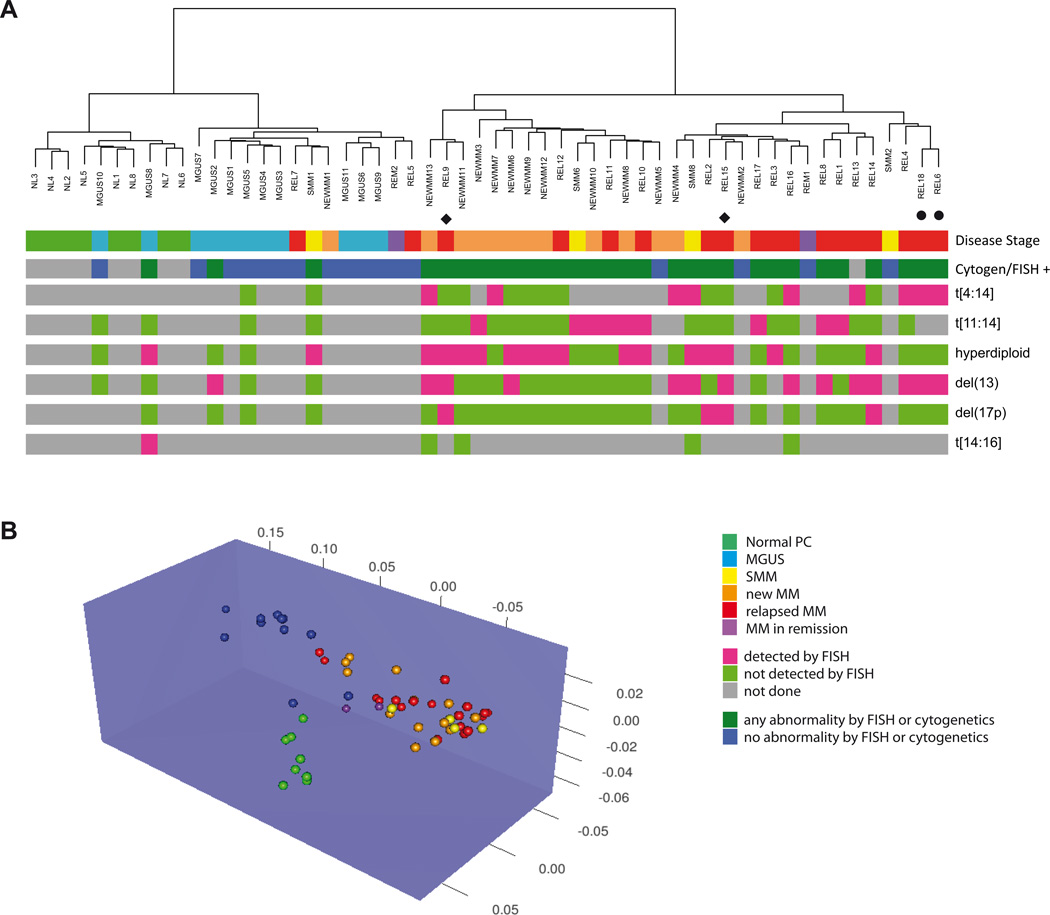
Figure 1. DNA methylation patterns can differentiate between different stages of plasma cell dyscrasias.
A) Unsupervised hierarchical clustering of using methylation profiles generated by the HELP assay separate the samples in two major clusters containing the majority of NEWMM (orange) and REL (red) samples or the majority of NL (green) and MGUS (light blue) samples respectively. These two clusters were also identified by the presence (dark green) or absence (dark blue) of abnormalities detected by FISH or conventional cytogenetics. The clusters are each further separated into two subgroups resulting in a total of four cohorts representing the majority of NL, MGUS, NEWMM and REL. Green = NL, blue = MGUS, yellow = SMM, orange = NEWMM, red = REL, purple = REM. The bottom 6 lines represent FISH data, green = not detected by FISH, pink = detected by FISH, gray = not done. ◆ or ● indicate paired samples.
B) Unsupervised 3D clustering based on nearest shrunken centroid algorithm using methylation profiles also shows distinction between normal and myeloma samples. Among the myeloma samples, clustering of MGUS samples is distinct from New and Relapsed cases. Green = NL, blue = MGUS, yellow = SMM, orange = NEWMM, red = REL, purple = REM

