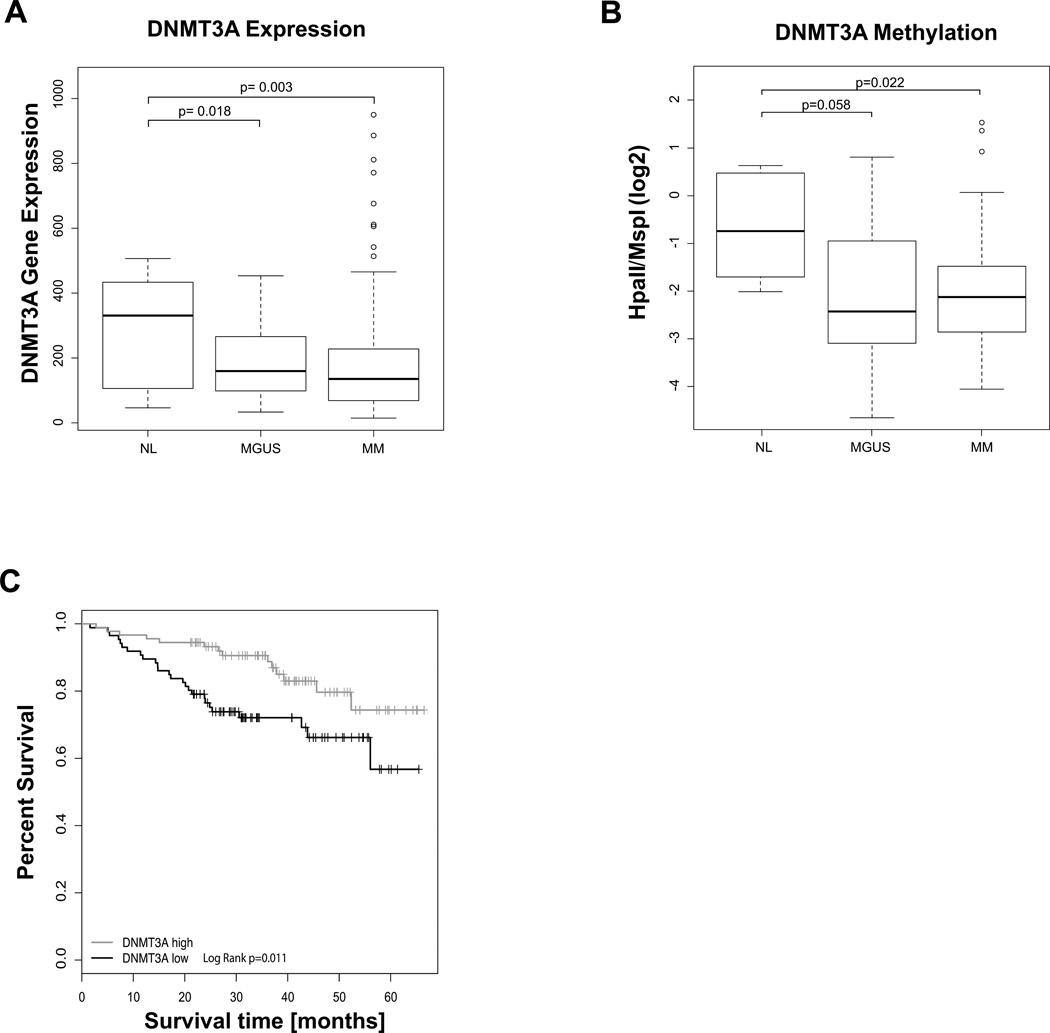
Figure 4. DNMT3A is underexpressed and hypermethylated in myeloma.
A) Box plots showing gene expression values in CD138+ cells from NL (n=22), MGUS (n= XX) and MM (n= 559) from Arkansas datasets GSE5900 and GSE2658 shows significantly reduced expression levels in myeloma (TTest, P Value< 0.05). The MM samples included in these datasets contained untreated samples. B) Boxplots representing the methylation of the DNMT3A promoter in normal PCs (NL), MGUS and myeloma samples (MM) shows hypermethylation in MM compared to NL (TTest, P Value <0.05). C) Low DNMT3A expression is associated with worse overall survival in TT2. Differences between groups with top and bottom quartile gene expression are shown with Kaplan Meier graphs.

