
Figure 1.
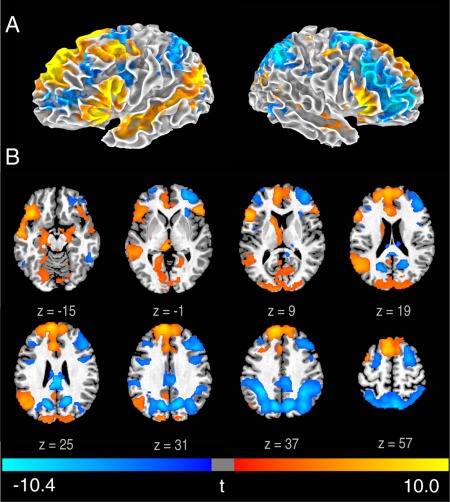
Brain activity associated with the generation phase.
Statistical t map of GenNewPoem‐RecMemPoem on a 3D brain surface (A) and axial slices (B) (FWE < 0.05). t‐scores are rendered in colors ranging from negative (violet) to positive (yellow) as indicated by the accompanying color bar.