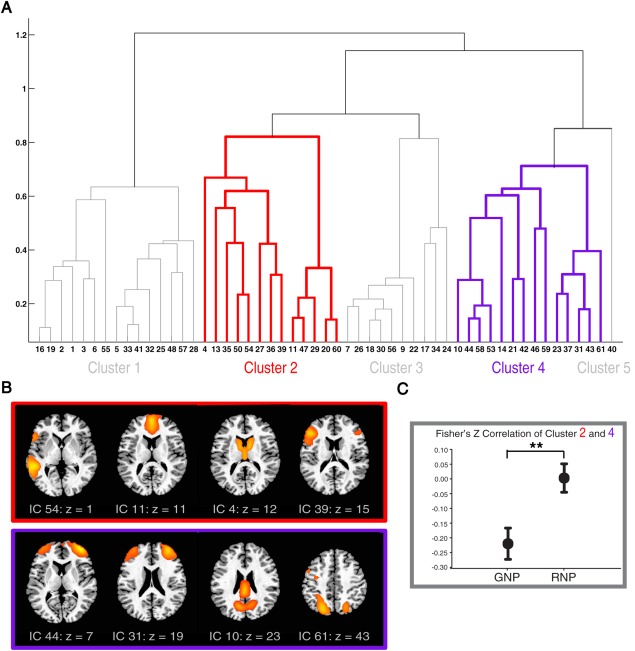
Figure 3.

Brain network connections associated with generation and revision phases.
(A) In functional network connectivity (FNC) analyses, the group ICA decomposition was first used to divide the whole brain into 53 spatially independent components (ICs), each representing a self‐organized functional network with homogenous temporal dynamics. In this data‐driven way, we are able to examine the whole brain systematically while avoiding the random nature of seed selection. The hierarchical clustering of these ICs yielded the dendrogram displayed here. On the basis of statistical similarities in temporal dynamics, ICs were organized into the 5 clusters shown. Cluster 2 (red) and cluster 4 (purple) were respectively centered on the MPFC and the DLPFC/IPS. Clusters 1, 3, and 5 include ICs representing auditory‐somatosensory‐motor, visual and retrosplenial areas, respectively (all five clusters are depicted in Supporting Information Fig. 3). In this dendrogram, the x axis represents ICs and the y axis indicates distance between two linked objects, that is, either ICs or sub‐clusters (see Methods for detail). (B) Selected ICs from clusters 2 (red) and 4 (purple) are displayed. The MPFC was grouped together with an extensive set of regions including perisylvian cortices and the caudate nucleus. Only paramedian areas of the precuneus and posterior cingulate cortex (PCC) were grouped with the DLPFC/IPS. (C) Inter‐cluster correlation was calculated between the averaged time series of all ICs in cluster 2 and 4. Significant anticorrelation between cluster 2 and 4 during the generation phase was reversed in the revision phase (N = 27, mean ± standard error, ** indicates P < 0.01).
