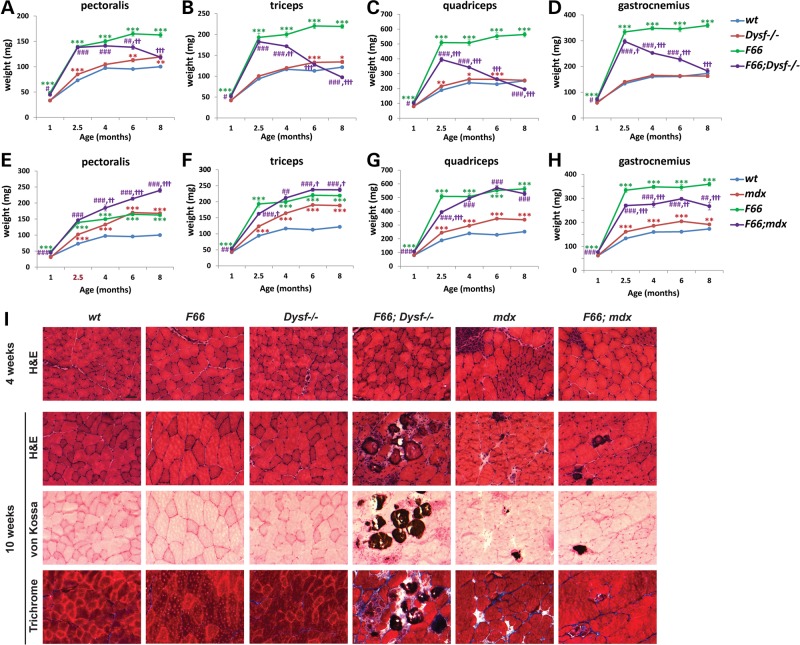
Figure 1.
Hypertrophy induced by Fst transgene expression accelerates muscular degeneration in Dysf−/− mice. (A–D) Effect of F66 on weights of pectoralis, triceps, quadriceps and gastrocnemius muscles in Dysf−/− mice as a function of age. Graphs were made from the data shown in Supplementary Material, Table S1. Note the dramatic loss of muscle mass induced by F66 in Dysf−/− mice beginning at 4 months of age. *P < 0.05 versus wt; **P < 0.01 versus wt; ***P < 0.001 versus wt; #P < 0.05 versus Dysf−/−; ##P < 0.01 versus Dysf−/−; ###P < 0.001 versus Dysf−/−; †P < 0.05 versus F66; ††P < 0.01 versus F66; †††P < 0.001 versus F66. (E–H) Effect of F66 on weights of pectoralis, triceps, quadriceps and gastrocnemius muscles in mdx mice as a function of age. Note that F66 did not induce muscle loss in mdx mice. Graphs were made from the data shown in Supplementary Material, Table S2. **P < 0.01 versus wt; ***P < 0.001 versus wt; ##P < 0.01 versus mdx; ###P < 0.001 versus mdx; †P < 0.05 versus F66; ††P < 0.01 versus F66; †††P < 0.001 versus F66. (I) Sections were stained with H&E, von Kossa (to highlight calcified fibers) and Masson's trichrome (to highlight areas of fibrosis). The F66;Dysf−/− mice showed the pathologic changes including fibrosis and centrally nucleated muscle fibers, even at 10 weeks of age, when Dysf−/− mice showed no distinct muscular degeneration. The F66;mdx mice showed the pathologic changes similar to mdx mice. Scale bar represents 50 µm.

