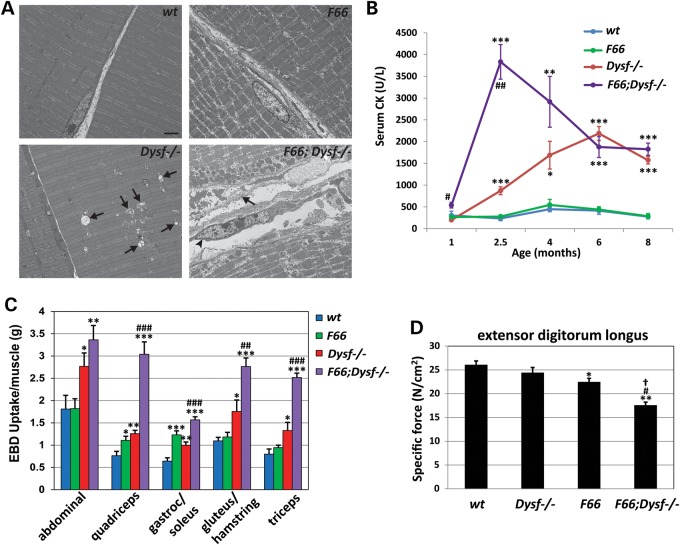
Figure 2.
Effect of Fst transgene expression on muscle fiber integrity and function in Dysf−/− mice. (A) Electron microscope images of quadriceps muscles at 10 weeks of age. While wt mice showed the regular sarcomeric pattern with no degenerative change in mitochondrial morphology, Dysf−/− mice showed membrane-bound spaces surrounded by swollen mitochondria (arrows in Dysf−/− image). F66 muscles showed randomly fragmented myofibrils in regular sarcomeric pattern, representing Type IIb fast-twitch fibers. F66;Dysf−/− muscles showed accumulation of vacuoles and mitochondria aggregation in subsarcolemmal area, necrotic fiber with complete loss of myofibrils (arrow in F66;Dysf−/− image) and fibroblast next to necrotic fiber (arrowhead). Scale bar represents 2 µm. (B) Serum CK (U/L) levels as a function of age. Note the sharp increase in CK levels in F66;Dysf−/− mice at 10 weeks of age. Graphs were made from the data shown in Supplementary Material, Table S3. *P < 0.05 versus wt; **P < 0.01 versus wt; ***P < 0.001 versus wt; #P < 0.01 versus Dysf−/−; ##P < 0.001 versus Dysf−/−. (C) EBD uptake by abdominal, quadriceps, gastrocnemius/soleus, gluteus/hamstring and triceps muscles. Note the increased EBD uptake in F66;Dysf−/− mice compared with the other groups. Graphs were made from the data shown in Supplementary Material, Table S5. *P < 0.05 versus wt; **P < 0.01 versus wt; ***P < 0.001 versus wt; ##P < 0.01 versus Dysf−/−; ###P < 0.001 versus Dysf−/−. (D) Specific force of EDL muscles from wt, Dysf−/−, F66 and F66;Dysf−/− mice at 4 months of age. F66;Dysf−/− mice showed a significant decrease in specific force compared with others. *P < 0.05 versus wt; **P < 0.01 versus wt; #P < 0.05 versus Dysf−/−; †P < 0.05 versus F66.

