
Figure 4.
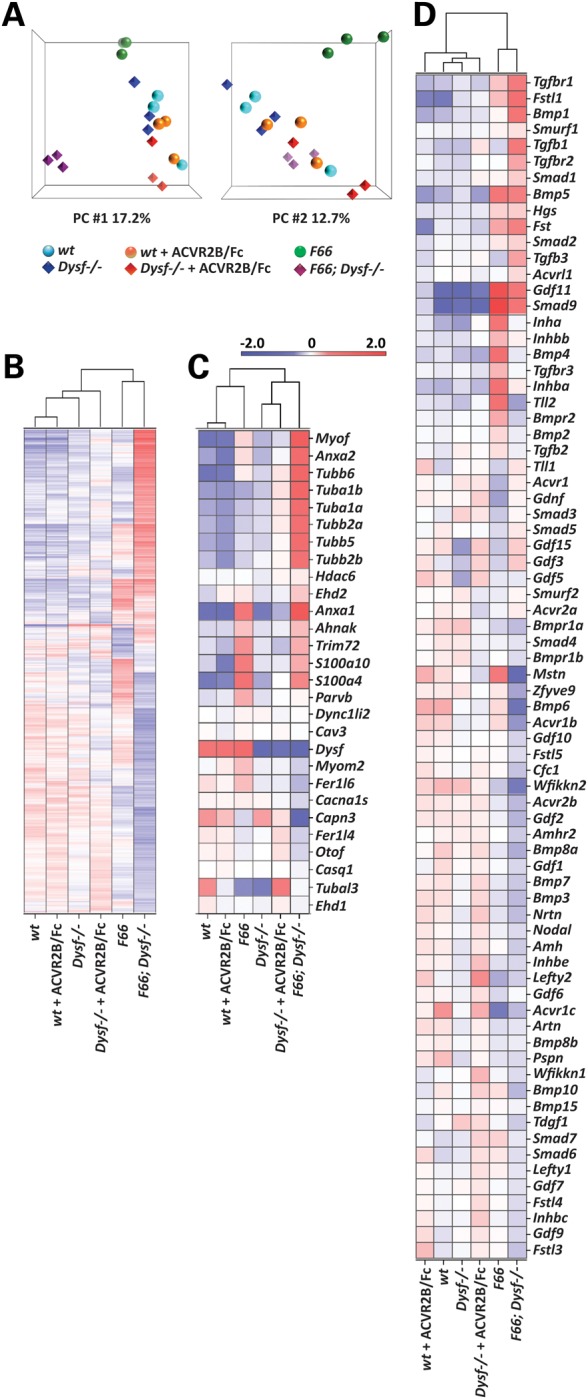
Analysis of global gene expression patterns in wt, Dysf−/−, F66, F66; Dysf−/− and ACVR2B/Fc-injected wt and Dysf−/− mice. (A) PCA mapping analysis. Affymetrix Mouse Exon 1.0 ST arrays were hybridized in three biologically independent experiments with RNA from quadriceps muscles of wt (blue circle), Dysf−/− (blue diamond), F66 (green circle), F66;Dysf−/− (purple diamond) mice and ACVR2B/Fc-injected wt (orange circle) and Dysf−/− (red diamond) mice (three replicates in six different groups: 18 samples). Note that F66;Dysf−/− and F66 groups are well segregated from each other and from the other remaining groups in PCA mappings. First component (PC # 1) and second component (PC # 2) data are shown. (B) Heat map corresponding to differentially expressed genes (P < 0.01). Data represent averages of three independent experiments in red (enriched) or blue (depleted). (C) Heat map corresponding to genes related to dysferlin function. Relative expression levels (fold change compared to wt) are shown in Supplementary Material, Table S8. (D) Heat map corresponding to genes encoding components of the myostatin/TGF-β signaling pathway. Relative expression levels (fold change compared to wt) are shown in Supplementary Material, Table S8.