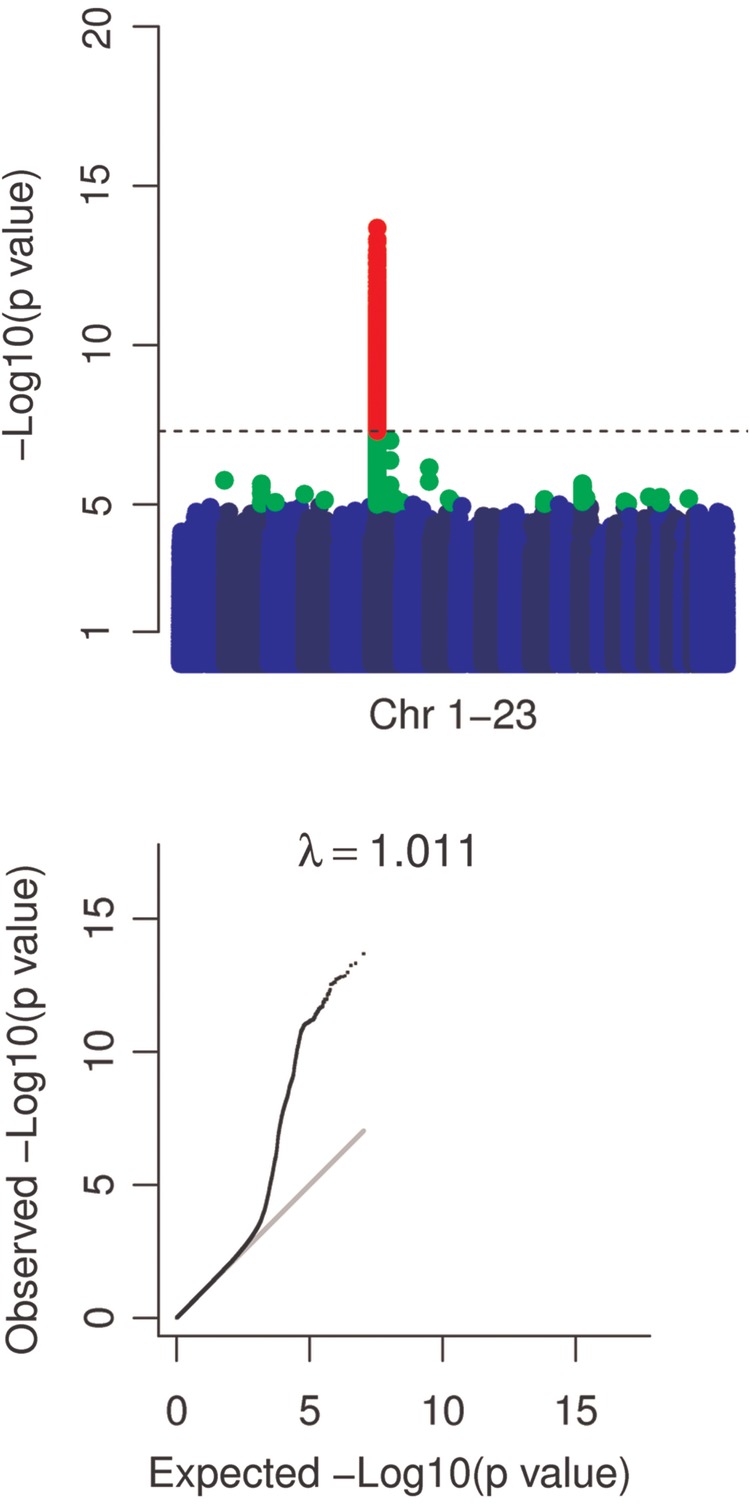
Figure 1.

Manhattan and QQ plots. Manhattan plots with markers P < 1.E − 5 in green and P < 5.E − 8 in red indicate a strong signal on chromosome 6. QQ plots of test statistics show inflation of associations at lower P-values. A grey line indicates a straight line relationship. The genomic inflation factor (λ) is shown in text above the QQ plot. Removal of the extended MHC region resulted in a genomic inflation factor of 1.007. A dashed line indicates P = 5.E − 8.
