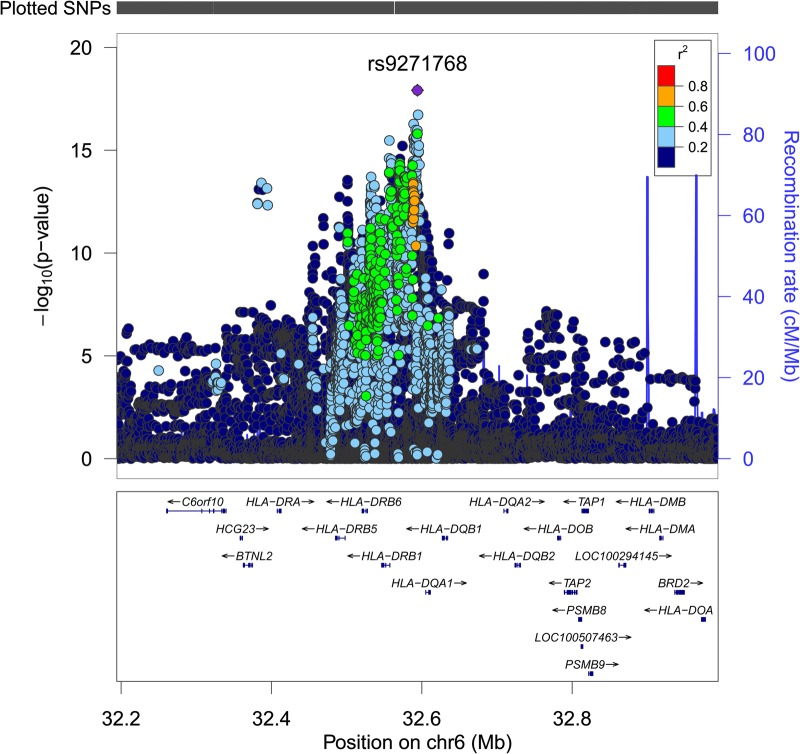
Figure 2.
Regional plot of lead association signal. P-values (on a −log10 scale) after meta-analysis are shown over the MHC class II region. Each SNP is coloured according to the degree of linkage disequilibrium with the lead SNP rs9271768 (shown as a purple diamond). Linkage disequilibrium values are from the 1000 Genomes (March 2012 release) European population.

