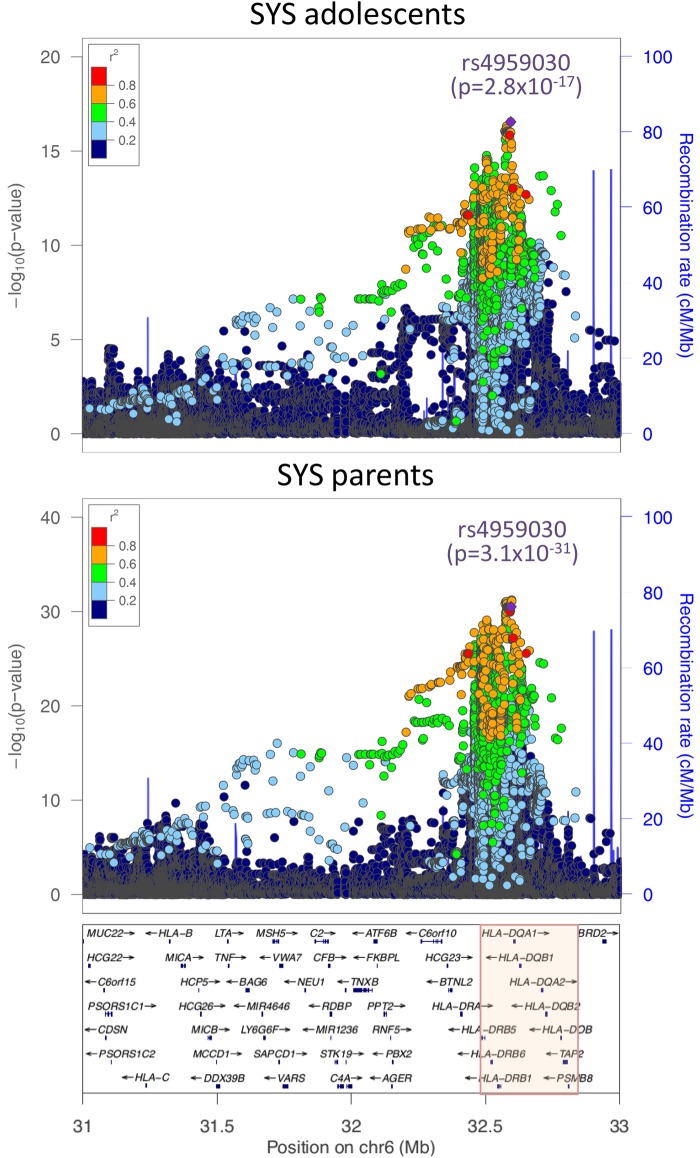
Figure 1.
Identification of the long-range meQTL with GWAS of PC1 in the SYS adolescents (top) and parents (bottom). Separate analyses were conducted in the samples of SYS adolescents (n = 132) and SYS parents (n = 278). Pink shaded area indicates the region of CpGs loading into PC1. In both the top and bottom panels, the purple dot indicates the top SNP associated with DNAm (PC1) in the discovery sample of SYS adolescents.

