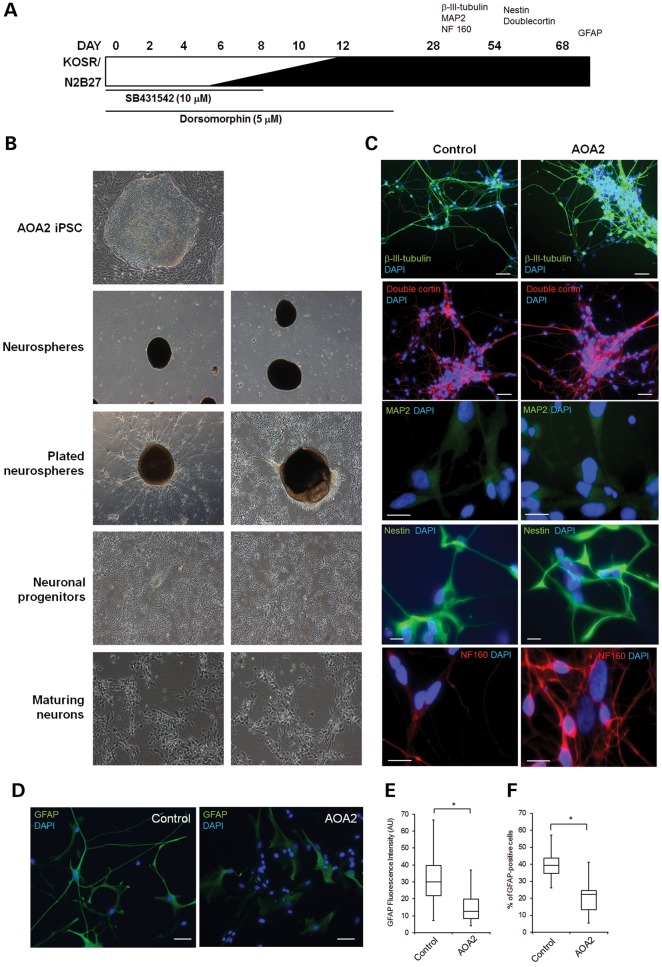
Figure 3.
Directed differentiation of AOA2 iPSCs into neural progenitors. (A) Schematic representation of neural induction protocol involving stepwise addition of N2B27 neurobasal medium and small molecules SB431542 and dorsomorphin for the first 6 and 12 days, respectively. Neurospheres were generated on day 6 of induction and plated after day 12, giving rise to colonies with neuronal projections and morphologies that were assessed for a range of neuronal makers, including β-III tubulin, MAP2, nestin, doublecortin, NF160 and GFAP. (B) Bright field images showing the differentiation of AOA2 iPSC into neural progenitors and maturing neurons. (C) Immunostaining for neuronal markers as indicated in the time line in (A). DAPI counterstained the nuclei. For β-III tubulin, doublecortin and nestin, scale bar represents 50 μm. For NF160 and MAP2, scale bar corresponds to 20 μm. (D) GFAP immunostaining of control and AOA2 neural progenitors. DAPI counterstained nuclei. Scale bar, 50 μm. (E) Reduced GFAP staining intensity in AOA2 compared with controls. More than 100 GFAP-immunoreactive cells for each population were used to quantify the average fluorescence intensity (AU) (*P < 0.05, Student's t-test). (F) Percentage of GFAP-positive cells was determined after counting manually more than 500 cells from each cell population (*P < 0.05, Student's t-test).

