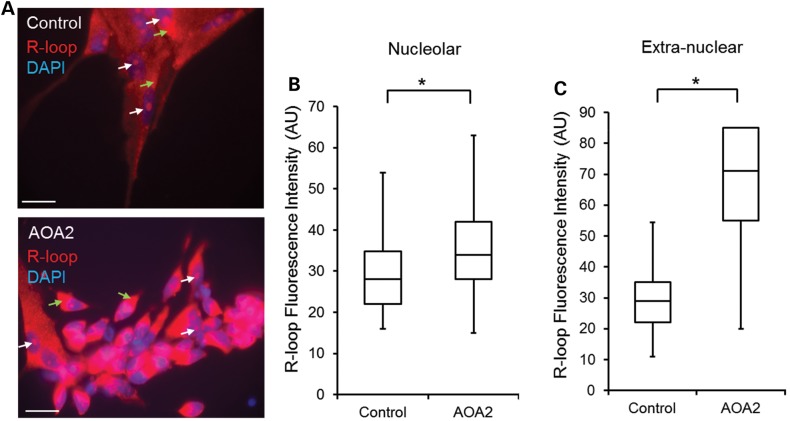
Figure 5.
Accumulation of R-loops in AOA2 neural progenitors. (A) Detection of nucleolar and extranuclear R-loops in control and AOA2 neural progenitors using S9.6 antibody (14). DAPI stained nuclei. Scale, 20 µm. White arrows indicate nucleolar R-loops and green arrows indicate extranuclear R-loops. (B and C) Quantitation of nucleolar and extranuclear R-loop fluorescence intensity (AU) in neural progenitors (*P < 0.05, Student's t-test). A significant increase of R-loop formation in nucleoli and mitochondria was observed in AOA2 neural progenitors compared with controls (*P < 0.05, Student's t-test).

