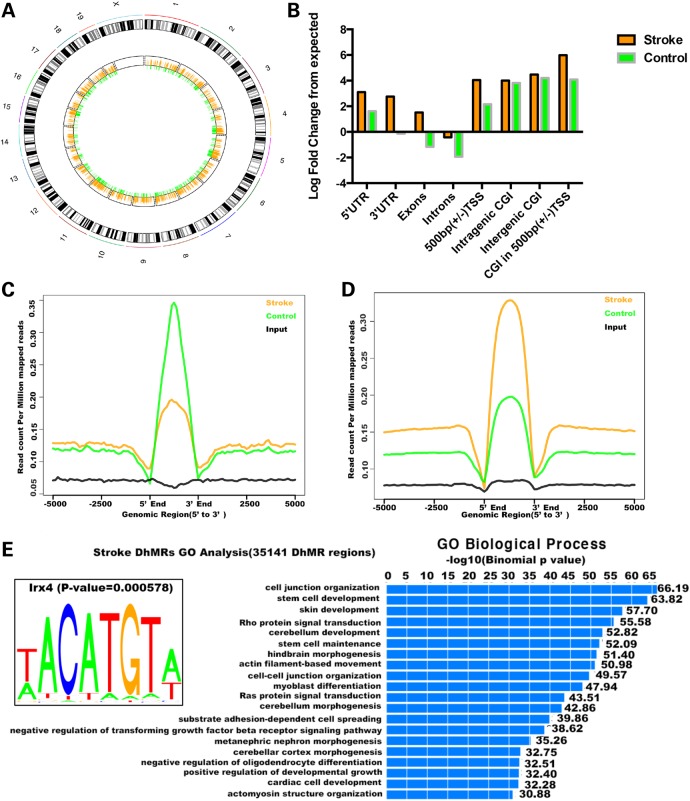
Figure 5.
Identification and characterization of DhMRs in stroke. (A) Chromosome circular map shows a genome-wide dynamic change of normalized 5hmC read count ratio between control and stroke in genome-wide DhMRs. The orange bar represents the normalized 5hmC read count ratio in control-specific DhMRs. The green bar represents the normalized 5hmC read count ratio in stroke-specific DhMRs. (B) Control- and stroke-specific DhMRs overlapping with various genomic features. (C and D) DhMR-associated genes showed differential 5hmC signals. (E) Gene oncology analyses for stroke-specific DhMRs. GO analysis was performed using GREAT with stroke-specific DhMRs. Most significant GO biological processes are indicated in the bar graph. Enriched IRX4-binding motif among stroke-specific DhMRs is shown.

